by David Beamish, DeFelsko Corporation
Updated: 09/20/2021

Abstract: Coating performance is related to the profile height on a steel surface. Three types of devices are available to take measurements of this surface profile: replica tape, depth micrometers fitted with pointed probes, and stylus roughness testers. This paper presents results from a recent analysis of measurements taken by the three device types on steel blasted with an assortment of blast media and proposes a new method of depth micrometer measurement called average of the maximum peaks.
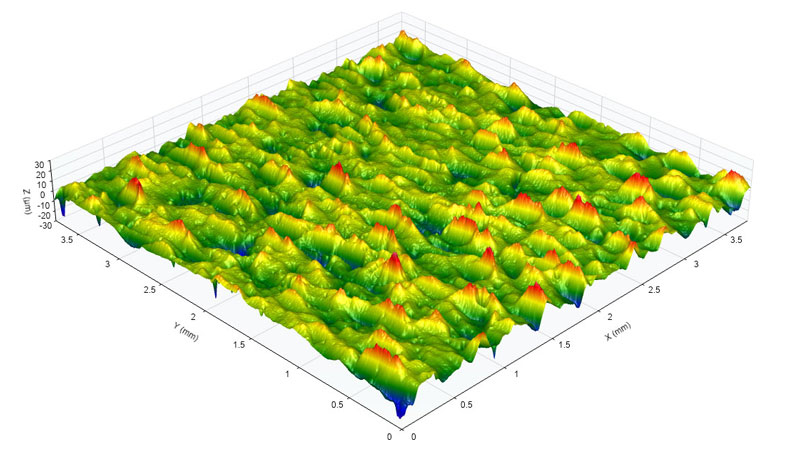
Steel surfaces are frequently cleaned by abrasive impact prior to the application of protective coatings. This process removes previous coatings and roughens the surface to improve coating adhesion. The resultant surface profile, or anchor pattern, is comprised of a complex pattern of peaks and valleys which must be accurately assessed to ensure compliance with job or contract specifications.
Protective coating professionals have several testing methods available to them for determining the amount of surface profile. Little information has been available to help them select an instrument or compare results from different methods.
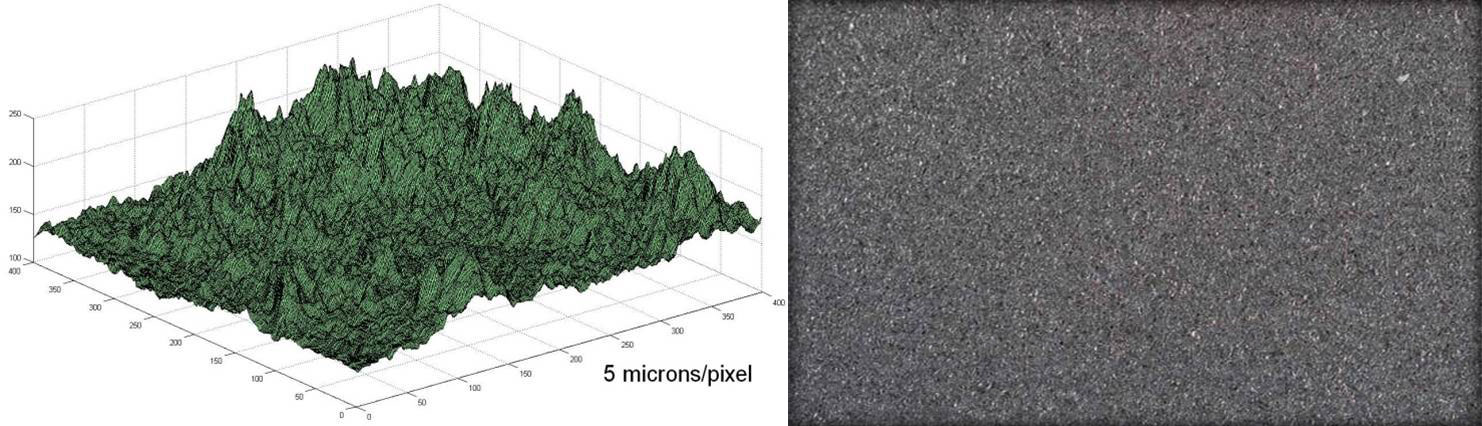
A steel surface after blast-cleaning consists of random irregularities with peaks and valleys that are not easily characterized. Instruments that can measure this profile with a high degree of precision, such as scanning electron microscopes, are suitable only for laboratory use. Field methods are desirable. Surface profile ranges are frequently specified and the recommended surface profile is different for various types of coatings.
The determination of surface profile depends on its definition. ISO1 8503-12 defines it as the height of the major peaks relative to the major valleys. ASTM3 D71274 describes it as the positive and negative vertical deviations measured from a mean line, approximately the center of the profile being evaluated. ASTM D4417-115 defines surface profile as, "the height of the major peaks relative to the major valleys". It describes 3 different measurement methods:

The industry does not have profile standards with values traceable to a National Metrology Institute. If they did, instruments could be verified against those standards, accuracy statements could be published, and users would have a means of correlating their results. Standards could determine the relationship of values obtained from replica tape to those obtained from depth micrometers, and so on.
Not having physical standards, the industry has chosen a referee method. NACE6, ASTM, and ISO describe surface profile height as distance measured from the top of the highest peak to the bottom of the lowest valley in the field of view of an optical microscope. A microscope is focused on the highest peak within the field of view. The distance travelled by the lens in order to focus on the lowest valley within the same field of view is a single measurement of profile height. The arithmetic mean of 20 such measurements results in the mean maximum peak-to-valley height. In other words, the average of the maximum peaks.
The microscope method is impractical in the field, so major organizations support a number of alternative methods that are both practical and routinely used by inspectors.
ISO manufactures surface profile comparators for steel blast-cleaned by shot or grit abrasives7 that are based on the focusing microscope method. Using visual or tactile means, the user compares the steel surface with the profile of each segment of the comparator to apply an appropriate grading of “fine”, “medium” or “coarse”. Annex B of ISO 8503-5 shows there is good correlation between these comparators and measurement by replica tape and stylus methods. There is no ISO method for depth micrometers nor should depth micrometers be used to measure on profile comparators due to the lack of flatness of the comparators.
NACE RP0287 (updated in 2016 to SP0287-2016-SG) also shows8 replica tape and focusing microscope measurements agree within their confidence limits (two standard deviations) in 11 of 14 cases.

Replica tape is simple, relatively inexpensive, and shows good correlation to focusing microscope results. It is not surprising then that it has arguably become the most popular field method for measuring surface profile.
Replica tape consists of a layer of compressible foam affixed to an incompressible polyester substrate of highly uniform thickness (2 mils +0.2 mils9). When pressed against a roughened steel surface, the foam collapses and forms an impression of the surface. Placing the compressed tape between the anvils of a micrometric thickness gage and subtracting the contribution of the incompressible substrate, 2 mils, gives a measure of the surface profile.
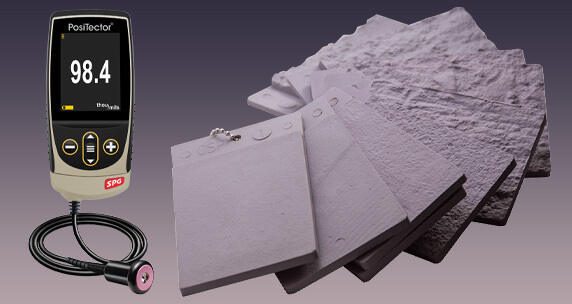
Automatically subtract the 50.8 μm (2 mils) incompressible film from all readings with the PosiTector RTR H Replica Tape Reader.

According to ISO 8503-5 “This method measures an ‘average maximum peak-to-valley profile’ because the anvils of the micrometer gauge flatten the replica profile slightly so that the reading equates to an average maximum value, though this is not the same as a mathematical average.” So again, we have a method that essentially measures the average of the maximum peaks.
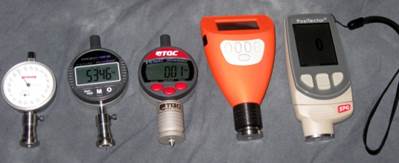
In recent years, two other methods of profile measurement have gained popularity: the stylus roughness tester (ASTM D7127) and the depth micrometer (ASTM D4417 Method B). Electronic versions of these instruments have the advantage of reduced operator influence and digital collection and analysis of measurement data.
For more information on digital surface profile instruments, please see the PosiTector SPG Digital Surface Profile Gauge or the PosiTector RTR H Digital Replica Tape Reader.
A portable stylus surface roughness measuring device operates by drawing a stylus at constant speed across the surface. The instrument records the up and down distances the stylus travels as it traverses across the surface. It measures Rt in compliance with ISO 428710 wherein Rt is the vertical distance between the highest peak and lowest valley within any given evaluation length of 0.5 inches. Five of these traces are made and Rt values averaged to again obtain the average of the maximum peaks.


ASTM committee D01.46 completed an 11 laboratory round robin assessment of precision and bias for this method by having participants measure five blasted steel test panels with replica tape and three stylus instruments. They selected stylus instruments that had adequate vertical range to be useful for measurement of the comparatively rough surfaces of interest to the coatings and linings industry. Even so, the profile on some of the panels exceeded the measuring limits of some of the selected instruments.
Preliminary findings confirmed a close relationship between replica tape and stylus roughness methods just as ISO concluded. When results are published, industry professionals will have access to reliable correlation data.
That leaves only the depth micrometer method without a comparison study. To provide correlation between all three device types, this paper proposes that depth micrometer measurements are analyzed using a method that produces results similar to tape and stylus results and is consistent with their measurement objectives, a method called "average of the maximum peaks".
To obtain this value, the profile is measured at a sufficient number of locations to characterize the surface, typically five. At each location, ten readings are taken and the highest reading is recorded. The average (mean) for all the locations is reported as the profile of the surface.
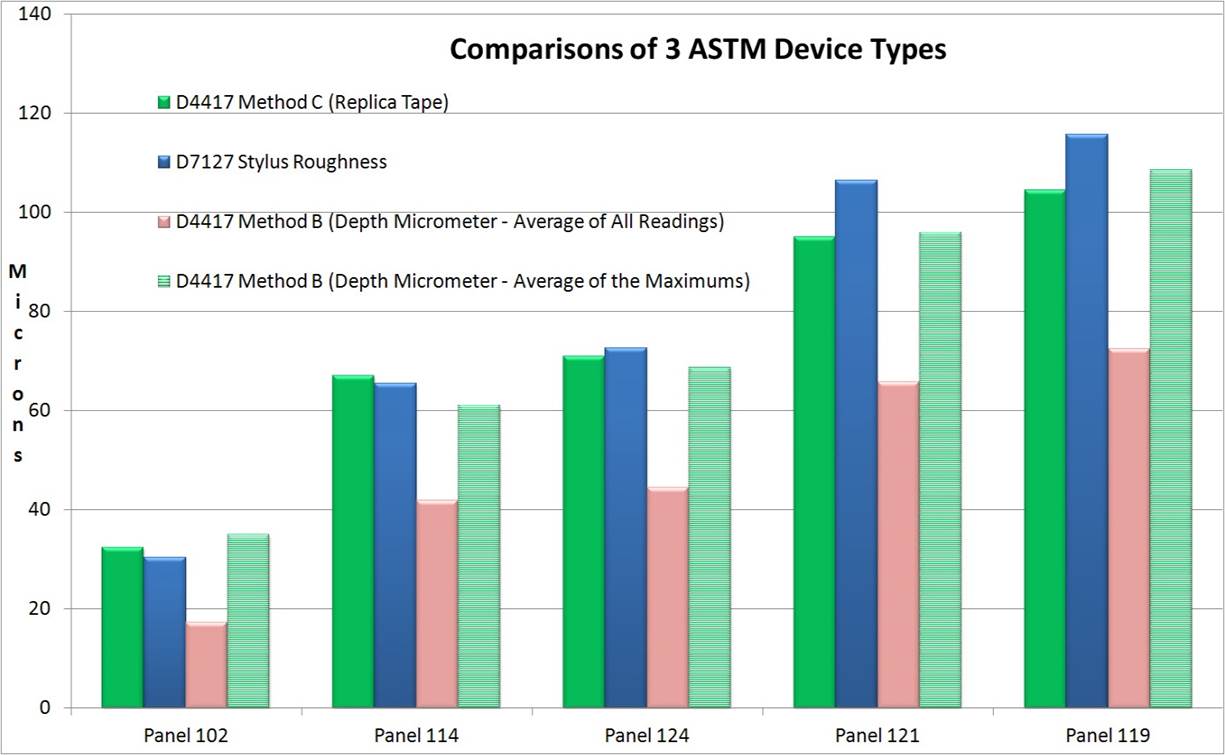
Impetus for this study came from preliminary testing on ASTM panels with a single depth micrometer instrument. As shown in figure 5, when the average of the maximum peaks method of analysis was used, depth micrometers results aligned closely with tape and stylus results.
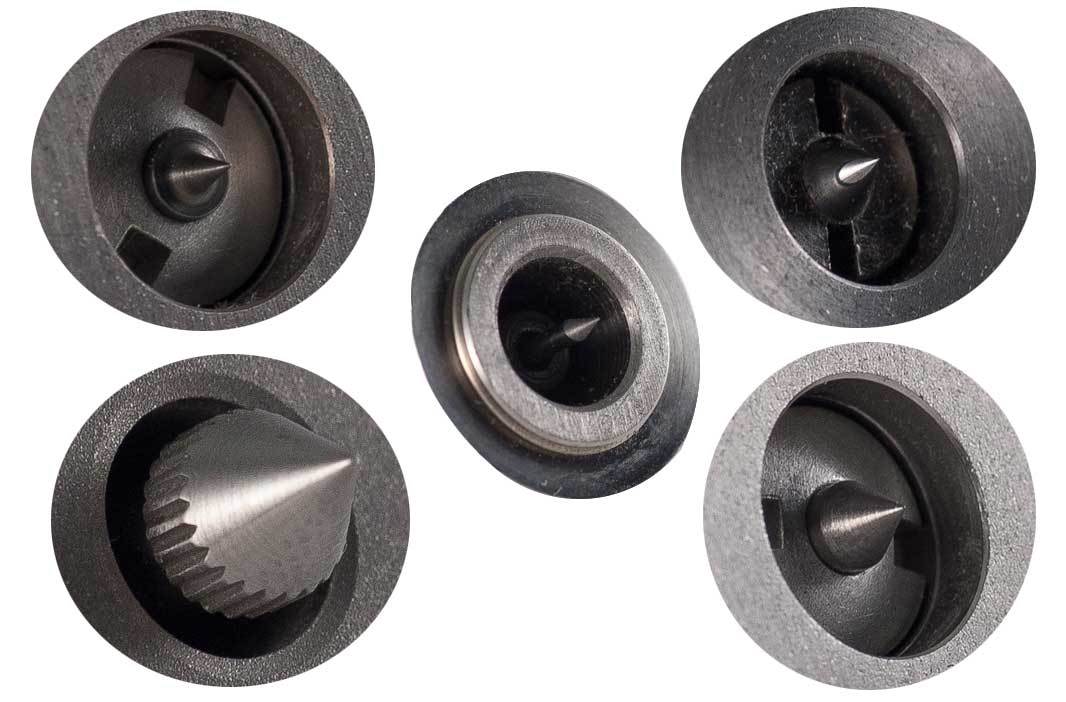
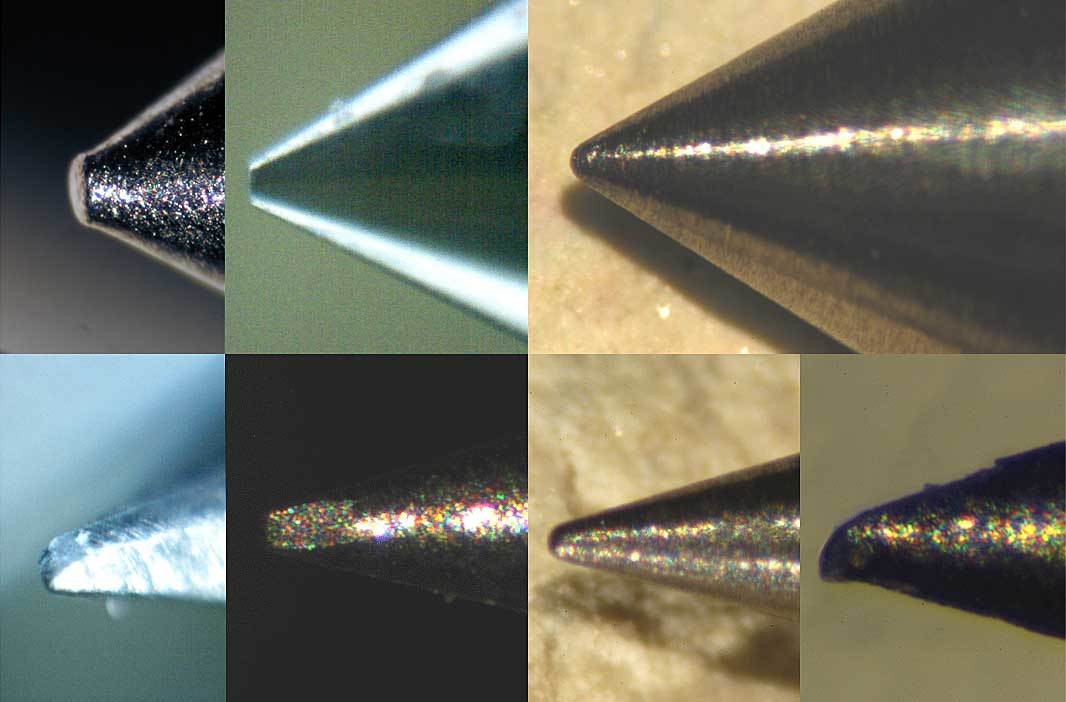
A depth micrometer instrument has a flat base which rests on the surface and a spring-loaded probe which drops into the valleys of the surface profile. The flat base rests on the highest peaks and each measurement is therefore the distance between the highest local peaks and the particular valley into which the tip has projected.

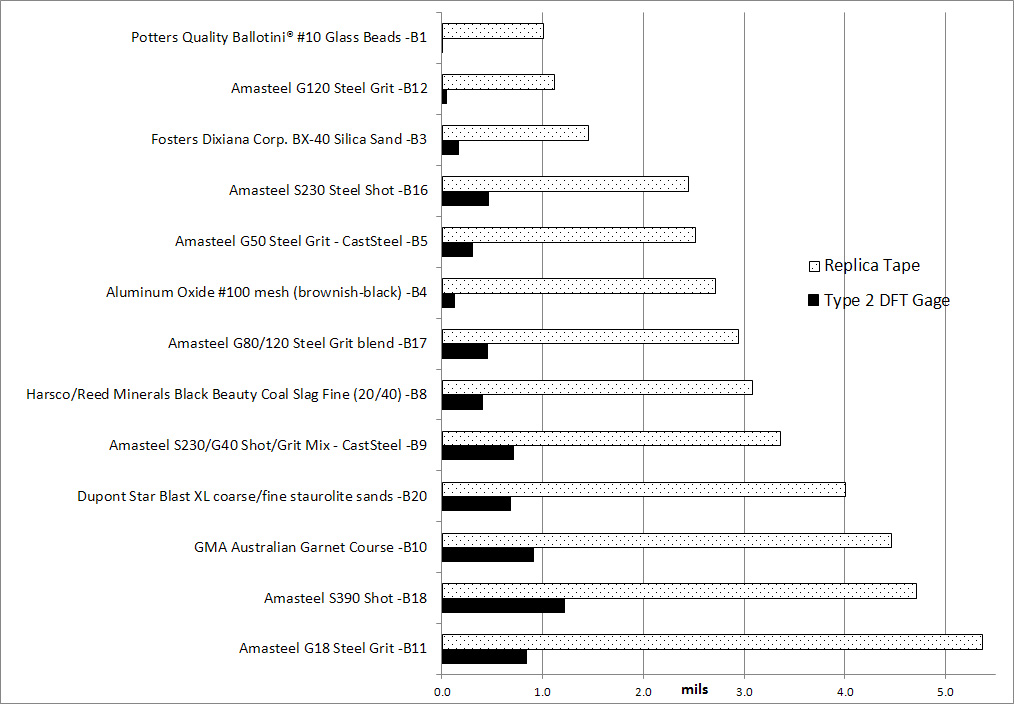
Currently, ASTM D4417 requires the user to average all depth micrometer measurements regardless of how low some readings might be. Not surprisingly, final calculated results are usually less than what is obtained by tape and stylus methods. This study confirmed that assumption (Fig.12). Occasionally one of the instruments would register values at or above tape results, but that was the exception.
After the ASTM 5-panel study referenced above, the depth micrometer method was the only method without a comparison study. To provide correlation between all three device types, this paper proposes that depth micrometer measurements are analyzed using a method that produces results similar to tape and stylus results and is consistent with their measurement objectives, a method called "average of the maximum peaks".
To obtain this value, the profile is measured at a sufficient number of locations to characterize the surface, typically five. At each location, ten readings are taken and the highest reading is recorded. The average (mean) for all the locations is reported as the profile of the surface.
Impetus for this study came from preliminary testing on ASTM panels with a single depth micrometer instrument. As shown in figure 5, when the average of the maximum peaks method of analysis was used, depth micrometers results aligned closely with tape and stylus results.
To confirm these results, twenty panels blasted with common media types were obtained from KTA Labs11 and five common depth micrometers were acquired. Five individuals took 50 measurements on each panel with each instrument in a controlled office environment for a total of 5,000 readings.
A minimum of 3 replica tape measurements were taken on each panel and averaged. When results fell in the outer regions of the tape’s range, additional measurements were obtained with the next level of tape and averaged as per the manufacturer’s instructions.
See "Replica Tape - A Source of New Surface Profile Information" for more information about Replica Tape Measurement.
Stylus roughness measurements were obtained from three common field instruments for comparison. Finally, base metal readings (BMR) from each panel were obtained from Type 1 and Type 2 magnetic coating thickness gages.

DFT probes measure the distance from their probe tip to the magnetic plane in the steel. On smooth steel the magnetic plane is coincident to the surface of the steel. On rough steel the magnetic plane lies somewhere between the highest peak and the lowest valley in the profile, a location that may differ by instrument type. Therefore roughness generally causes DFT instruments to read high, or a positive value.
SSPC-PA 2 and other standards require a correction factor be applied in order to compensate for this roughness effect. Commonly, a plastic shim is placed over the bare profile and measured with the DFT gage. The gage is adjusted so that the result matches the thickness of the shim. The shim simulates the paint build-up over the peaks and the adjustment ensures paint thickness measurements are taken from the average level of the peaks of the profile, rather than from the magnetic plane.
To quantify the effect of profile on DFT gages, measurements were taken on all panels by Type 1 (mechanical pull-off) and Type 2 (electronic) instruments after first being zero-checked on smooth, flat steel. The average result of five measurements was recorded for each panel.
The Type 1 instrument was least affected by profile and measured a maximum of 0.3 mils on the roughest surface. The Type 2 instrument measured between a low of 0 on the glass bead blasted surface and a high of 1.2 mils on the S390 shot blasted surface. Overall, the DFT instrument gave thickness results that ranged between 1 and 26% of surface profile heights as measured by replica tape, with an average of 13% across all panels.
Some surface roughness exceeds the measuring capabilities of tape and stylus methods. Good practice suggests that commercial grades of tape permit measurement of average peak-to-valley profiles of between 0.5 to 5.0 mils. All depth micrometers used in the study had extended ranges suitable for measuring blasted steel surfaces and did not "max" out on any of the panels.
View the PosiTector SPG Surface Profile Gauge ordering guide for measuring ranges.
Several panels had areas where all instrument types produced high profile values. These variances might have been due to the inconsistent nature of blasting by hand. It can be assumed larger surfaces would have similar irregularities.
It was not possible to test with each device in the exact same location on each panel (Fig.7). Replica tape examined a relatively large area thus requiring fewer measurements to adequately characterize the surface. Stylus and depth micrometer methods have fine-tipped probes which sample a much smaller surface area and therefore required more measurements to adequately characterize a surface. ISO, ASTM, NACE and SSPC guides take this into account.
All methods required initial setup and accuracy verification before testing began.
Refer to the PosiTector SPG and PosiTector RTR H instruction manuals to learn about setup and accuracy verification.
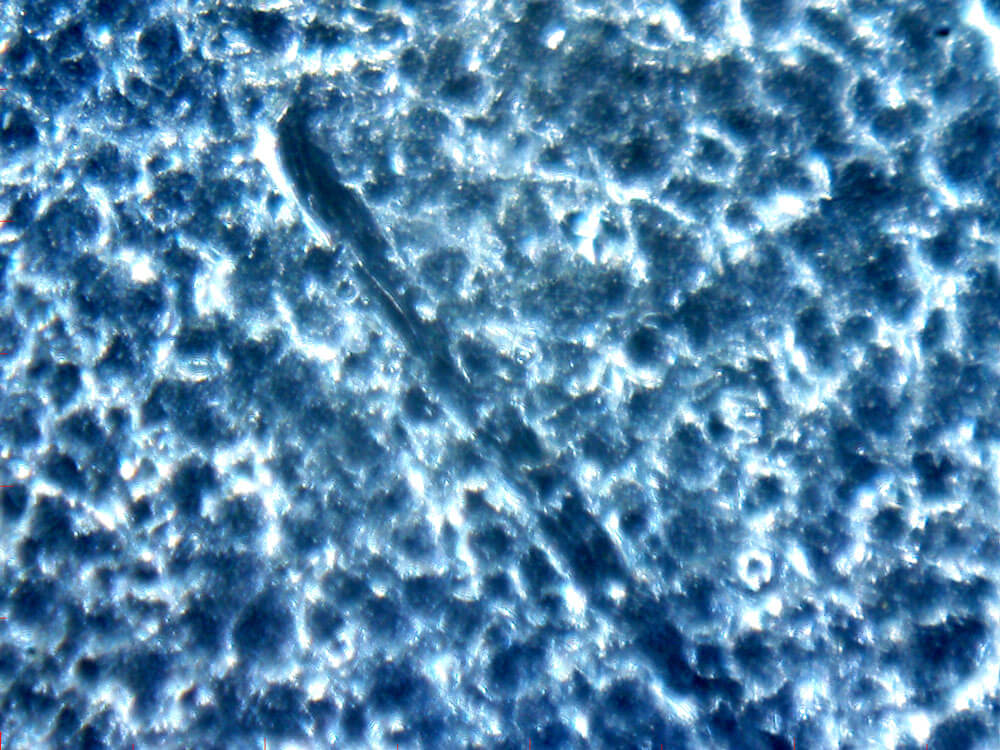
Circles were observed on some panels after testing with replica tape. It is believed they were the result of microscopic particles getting impressed into the foam and being carried away when the foam was peeled off. Scratches were observed on some panels after testing with the stylus instruments. It is believed the steel surface was slightly modified as the diamond-tipped stylus was dragged over the peaks (Fig.9).
It becomes clear during testing that individual surface profile measurement results are less repeatable and have greater variation than users have come to expect from other forms of industry measurement such as dry film thickness (DFT), temperature or gloss testing. While two DFT measurements might be expected to be very close, two surface profile measurements can differ considerably. Such is the nature of a blasted surface.
For example, on a panel blasted with a mixture of coarse and fine staurolite sands, replica tape measurements ranged between 1.8 and 2.9 mils, stylus instruments between 1.8 and 2.8 mils, and depth micrometers between 0 and 5.6 mils. Yet all three methods gave final “average of the maximum peaks” results of approximately 2.5 mils.
Just as often, however, the three methods yielded results that were not as close. Tape and stylus results sometimes varied by as much as 30%. On 2 panels blasted with S280 shot and #100 mesh aluminum oxide, replica tape read 2.7 mils on both while the stylus method averaged a lower 2.2 mils on both. Conversely on BX-40 silica sand, replica tape read 1.5 mils while the stylus method averaged a higher 1.9 mils. The average values obtained from three stylus instruments were higher than replica tape values on all 4 sand blasted panels and lower on all oxide and shot blasted panels. See figure12 for a summary of replica tape vs. stylus results.
The following points were observed when performing surface profile measurements with the depth micrometers:

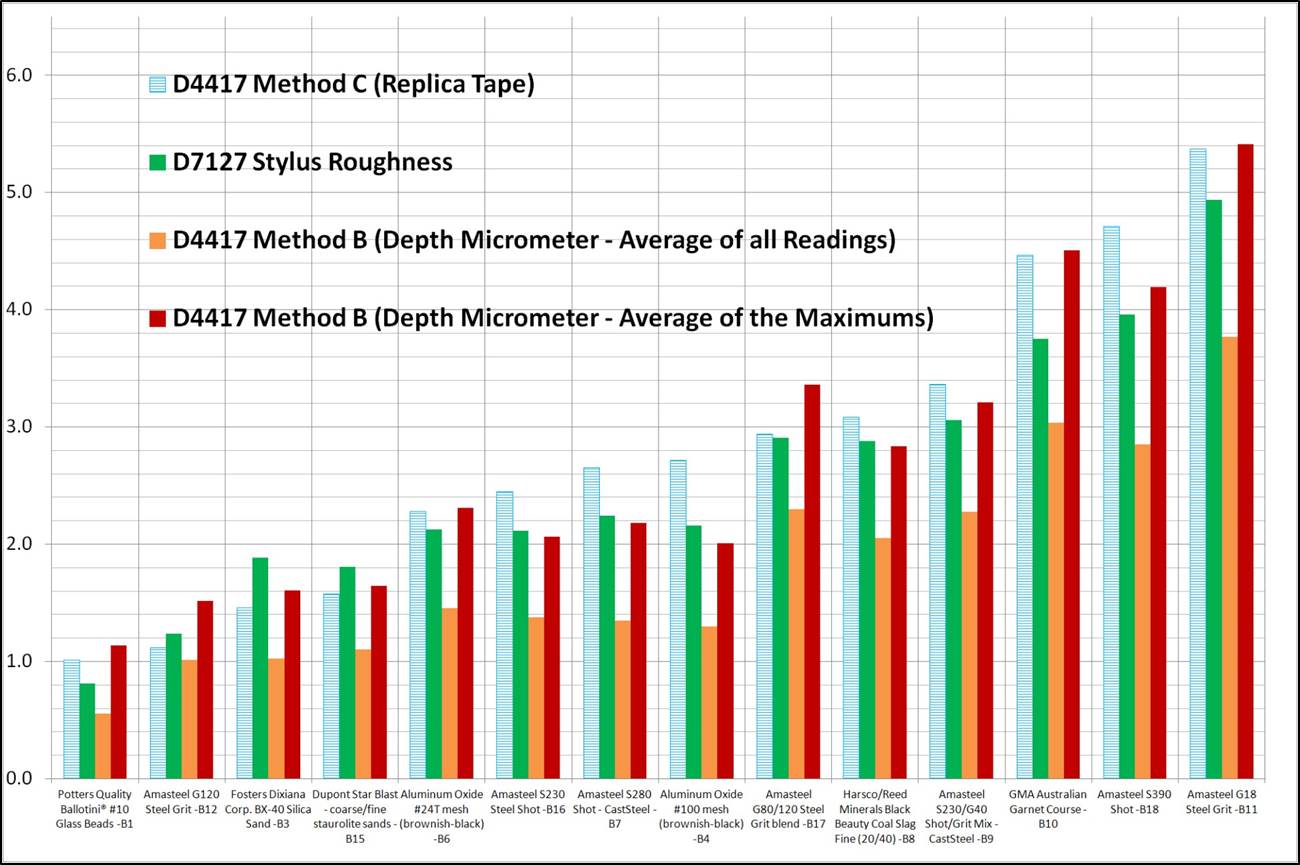
Results from this study confirm a close relationship between tape and stylus measurements as first shown by ASTM round robin testing. The results also revealed interesting information about the third measurement device type, surface profile depth micrometers, which achieved results comparable to tape and stylus when “average of the maximum peaks” analysis approach was used (Fig.12).
The surface of blasted steel at any point is a random variation, so a number of readings must be taken. The assessment objective is to make maximum peak to valley determinations. Individual measurements of the surface of an abrasive blast-cleaned metal surface vary significantly from area to area over a given surface. How these measurements are combined depends on the parameter required for the job which could be the average peak-to-valley height, its maximum, or even something else. By employing the “average of the maximum peaks” analysis approach, a depth micrometer gives reliable surface profile measurements that correlate closely to replica tape and stylus roughness tester results.
PosiTector SPG Advanced models feature a SmartBatch™ mode to comply with various standards and test methods. By default, SmartBatch™ generates results close to those obtained with replica tape and drag stylus methods by automatically averaging the maximum profile depth for all spots within the test area and displaying "the average of the maximum peaks".

DAVID BEAMISH (1955 – 2019), former President of DeFelsko Corporation, a New York-based manufacturer of hand-held coating test instruments sold worldwide. He had a degree in Civil Engineering and more than 25 years of experience in the design, manufacture, and marketing of these testing instruments in a variety of international industries including industrial painting, quality inspection, and manufacturing. He conducted training seminars and was an active member of various organizations including NACE, SSPC, ASTM and ISO.