This paper will evaluate methods used to measure surface profiles created by power tools, namely air needle scalers, bristle cleaners, and roto peen scalers. Particular focus will be placed on the use of replica tape and its ability to characterize profiles of various surfaces using a digital replica tape reader with 3D imaging capability. More specifically, this paper will determine if the measurement methods described in ASTM D4417 are appropriate for the measurement of profiles produced by power tools.
NAVSEA defines hand power tools as portable automatic devices used for surface preparation that can be broken down into three basic categories:
While there are many standards relating to the measurement of surface profiles produced by abrasive-blasting of steel surfaces, there is little research or guidance for measuring profiles created by power tools.
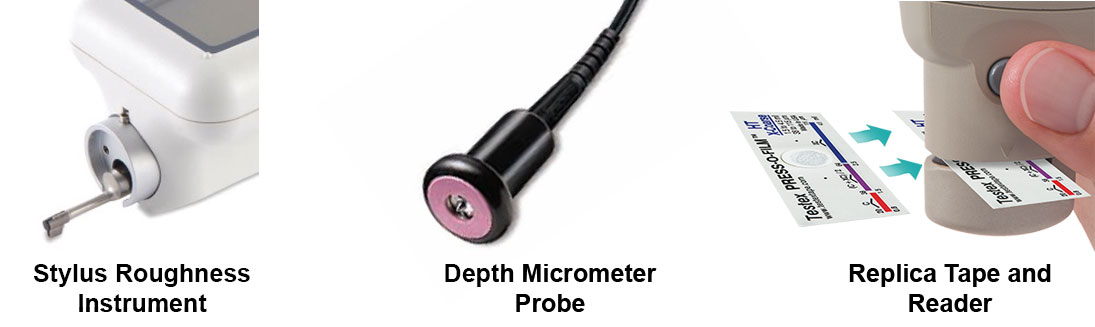
This paper will examine three common measurement methods for determining surface profile parameters and evaluate their efficacy on power tool prepared surfaces: spring micrometers using replica tape, depth micrometers, and stylus roughness instruments. Profiles produced by air needle scalers, bristle cleaners, and roto peen scalers on steel test panels were examined for this study.
Attention will be paid to each measurement method’s effectiveness to measure on all three power tool produced profiles and whether any of the power tools produce profile characteristics that present challenges. Through evaluation of data, plotting subsequent results and the use of 3D surface imaging, a final recommendation will be made as to which measurement method is the most appropriate.
Surface Preparation directly affects the performance of protective coating systems. Ensuring that a surface is clean of rust and mill scale, as well as surface contaminants such as dirt, oil, soluble salts, and grease is critical. Equally important is the surface profile, the characteristics of which contribute to the coating lifespan and adhesion strength. Evaluation of surface profile, then, becomes a critical exercise.
Power tools are frequently used to clean steel surfaces prior to the application of protective coatings. While the profile of abrasive blasted surfaces is routinely measured with replica tape, depth micrometers, or portable stylus roughness instruments, coatings professionals are often uncertain which method is best suited for profiles created by power tools including air needle scalers, bristle cleaners, and roto peen scalers.
Abrasive impact produces complex, random patterns across the surface. However, surface profiles produced by power tools exhibit repetitive patterns that present challenges to proper peak-to-valley height and peak density measurement.
In an article written in February 2015, D. Beamish2 illustrated how replica tape could be used to determine critical surface profile parameters for blasted steel surfaces and related these parameters to pull-off adhesion strength. Specifically, the article discussed how significantly more information was available through replica tape measurements over other measurement methods, allowing for Peak Density (Pd) and Developed Interfacial Area Ratio (Sdr) to be determined, which directly correlated to pull-off adhesion strength. Further, it was shown that surface parameters measured using replica tape were closely correlated to established measurement techniques for blasted profiles, such as confocal microscopy and stylus profilometry. This paper will take this analysis further and determine the suitability of replica tape to not only measure surface parameters of blasted profiles, but to measure surface profile across a variety of power tool prepared surfaces.
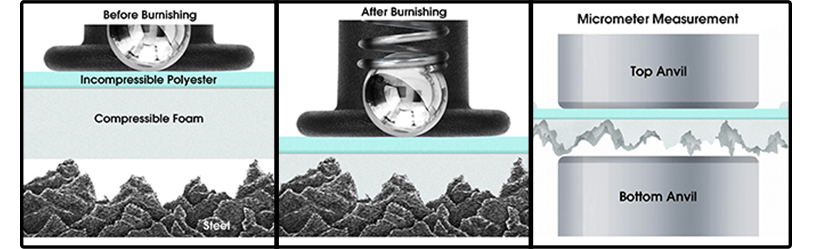
Replica tape has been used since the 1960s to measure the surface profile of blasted steel. Widely used in the coating industry, replica tape consists of a layer of crushable plastic foam attached to a non-compressible polyester substrate of a highly uniform thickness of 2 mils ± 0.2 mils (50.8 microns ± 5 microns). The foam thickness is dependent on the tape grade. Replica tape is available in two types, regular and optical, and two grades, Coarse and X-Coarse. For most applications, regular replica tape is sufficient. Optical grade replica tape is used when producing 3D images of the tape surface. The two tape grades are Coarse, which measures profiles from 0.8 – 2.5 mils (20 to 64 µm), and X-Coarse, which measures profiles from 1.5 – 4.5 mils (38 to 115 µm).
When pressed against a roughened steel surface, the foam forms an impression, or reverse replica, of the surface. The foam can collapse to about 25% of its pre-collapse thickness. Therefore, as the highest peaks on the original surface push up to the polyester backing, the fully compressed foam is displaced sideways. Likewise, the deepest valleys on the original create the highest peaks in the replica.
Placing the compressed tape between the anvils of a spring micrometer, like the PosiTector RTR H, and subtracting the contribution of the incompressible polyester substrate (2 mils / 50 µm) gives a measure of the average maximum peak-to-valley surface roughness profile (Fig.1).

This method for surface measurement is rugged, relatively simple, inexpensive, and allows the user to retain a physical replica of the surface being evaluated. It is one of the most common ways to determine peak-to-valley height of blasted surfaces in the coating industry.
Replica tape provides added advantages over other measurement methods in that it measures the surface profile over a two-dimensional area, rather than a single point or straight line measurement. The pointed probe tip on a depth micrometer measures a single point with a radius of approximately 0.05 mm (50 microns), for a sampling area of 0.007 mm2. The typical sample line of a stylus roughness instrument is 12.5 mm long and 4 microns wide, for a total measurement area of 0.05 mm2. The measurement area of replica tape is 31 mm2. This represents a measurement area roughly 258 times larger than the measurement area of a stylus roughness instrument and approximately 4,400 times larger than the depth micrometer. Further, when using an instrument such as the PosiTector RTR 3D, digital imaging of burnished replica tape can produce 3D images of surface profiles, allowing a user to visually observe the surface prior to coating application.
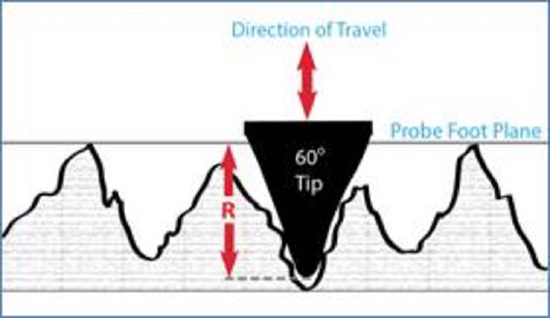
A depth micrometer, like the PosiTector SPG, uses a flat base that rests on the peaks of the surface profile and a spring-loaded probe tip mounted inside the base which drops into the valleys of the profile. The flat base rests on the highest peaks and each measurement is therefore the distance between the highest local peaks and the particular valley into which the tip has projected, as illustrated in Figure 2. Depth micrometers have the advantage of being able to measure profile heights that exceed the range of many other instruments.
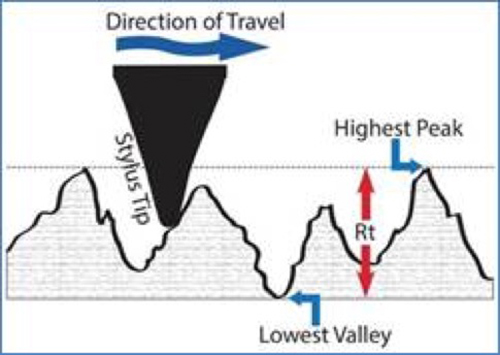
A portable stylus roughness instrument utilizes a stylus that is drawn at constant speed across a surface and records the up and down movements to determine the Rt, or the vertical distance between the highest peak and lowest valley within any given evaluation length. The instrument measures and records the vertical distance the stylus travels as it passes over the surface, as seen in Figure 3.
Typically, a predetermined evaluation length is divided into 7 sampling lengths and the instrument measures the peak-to-valley height within each sampling length, Ry, of each section, disregarding the first and last sections. The average of the remaining Ry’s is used to calculate Rz. For this study Rz is equivalent to RzDIN, equaling the average of the distances between the highest peak and lowest valley in each sampling length, per ASME Y14.36M7.
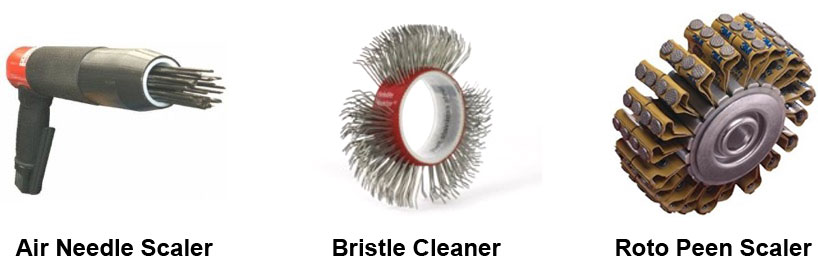
Twelve steel plates were prepared using three different power tools: an air needle scaler, bristle cleaner, and roto peen scaler, illustrated in Fig. 4. These panels were labeled 1 through 4 within each group.
The following panels were evaluated:
Surface profiles on the panels were evaluated with the following three instruments:
Testing was performed with each instrument in the following manner:
1. A portable stylus roughness instrument was used to determine Rz and Rpc for each panel. Three trace measurements were performed at 5 locations on each panel with each trace measurement having an evaluation length of 12.5 mm, and a sampling length of 2.5 mm.
a. Measurement locations are detailed on Diagram 1. It should be noted that on the bristle cleaner prepared panels trace measurements 2 & 4 are in the direction of bias, while trace measurements 1, 3, and 5 are against the direction of bias. For the roto peen scaler panels, trace measurements 2 & 4 are against the direction of the bias and trace measurements 1, 3, and 5 are in the direction of bias.

2. A digital depth micrometer was used to determine Rt. 10 measurements were taken at 5 locations on each panel, for a total of 50 measurements per panel. Per D4417, 10 readings per location were taken. This study used 5 locations and the maximum values of the 10 readings in the 5 locations was recorded and averaged. The average of the 50 individual readings was also recorded. Sampling locations are detailed in Diagram 2:

3. A digital replica tape reader and imager used replica tape to measure HL and Pd. Four burnishings were taken per panel. Three were taken using regular Replica Tape (Coarse and/or X-Coarse) and one was taken using Optical Replica Tape. Measurement locations are shown on Diagram 3:

1. Patterns were seen in the results. When examining images of the surfaces, directional striations were visible on the bristle cleaner and roto peen scaler prepared surfaces. The readings taken by the stylus roughness instrument in the direction of this directional bias and against the bias confirmed clear differences in the surface parameters. Further, images of the air needle scaler prepared surfaces showed they had few distinct peaks and valleys, leading to speculation that the depth micrometer may not have adequately captured true peak-to-valley heights. It was hypothesized that results would improve with modified measurement techniques that accounted for bias/peak density:
a. Bristle cleaner/roto peen scaler prepared panels showed directional bias that presented challenges for portable stylus roughness instruments. A portable stylus roughness instrument may not be appropriate because readings are bias dependent. Initial specifications (D7127) for measuring power tool cleaned surfaces do not account for bias and/or density of peaks. This may lead to under or over reported values on surface profile. Modifying the test method to ignore readings taken in the direction of the bias is necessary to produce meaningful results.
b. It was observed that the air needle scaler prepared panels had very low peak density (peak frequency). It was proposed that increasing the number of measurements taken with the depth micrometer might help to account for this decreased frequency and produce a more accurate result. To evaluate this hypothesis, a second round of testing was done taking 20 measurements per spot in all 5 locations, for a total of 100 readings per panel. The average of the 5 maximums was reported.
2. Results indicated that replica tape could be used across all three power tool produced profiles. Results acquired with a digital replica tape reader were not significantly affected by the bias and density that present challenges to the other instruments, and there was no need to modify the test method.
3. The depth micrometer results showed that using the average of the maximums for the five locations produced results that correlated more closely with results from the other measurement methods when compared to the average of the 50 individual readings.
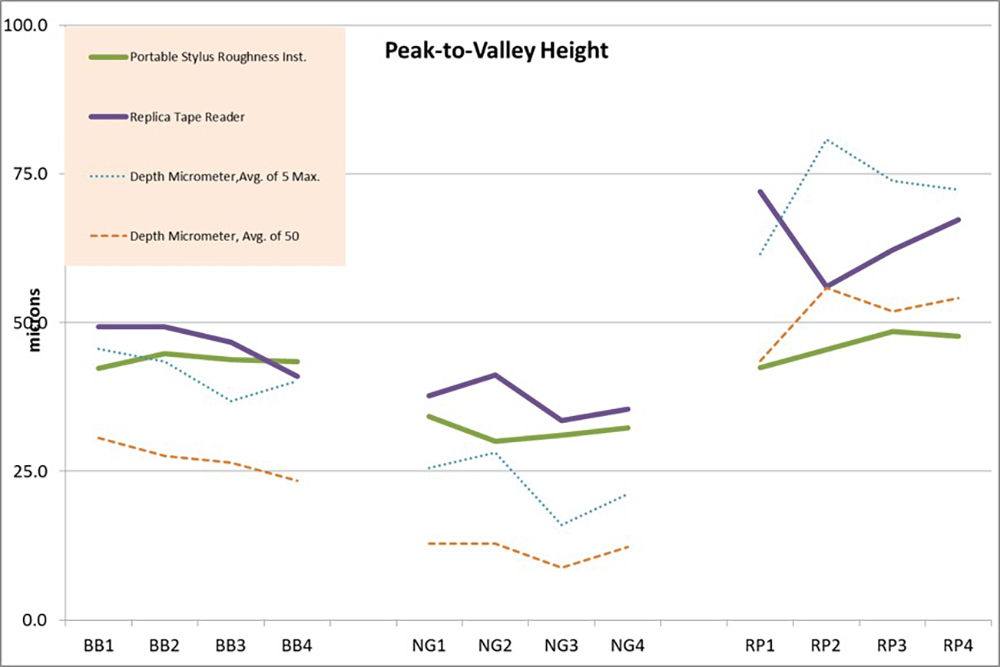
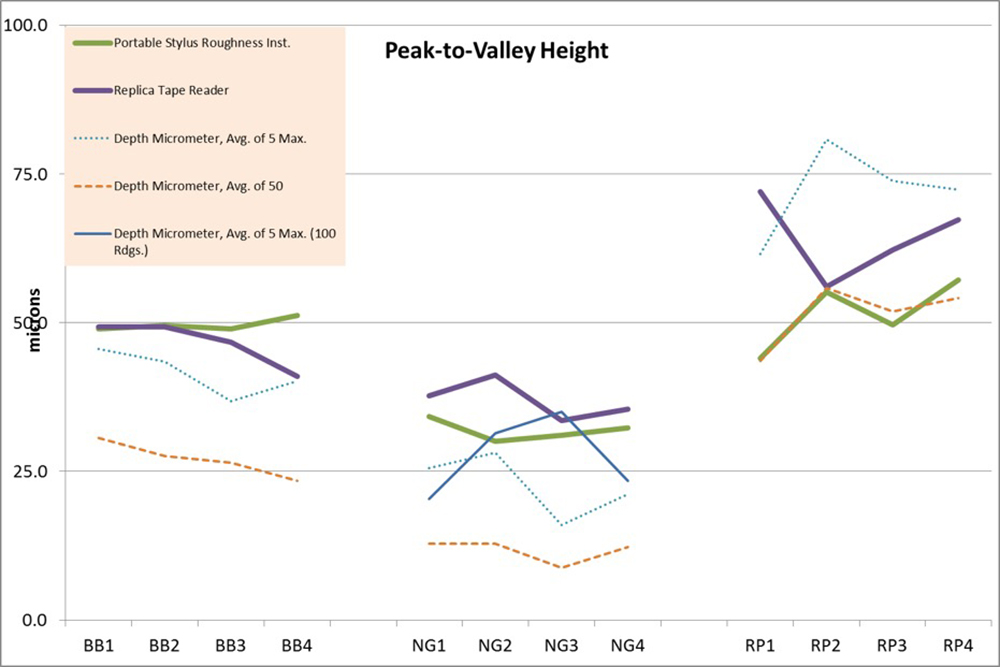
Chart 1 shows the initial results of the three measurements methods. The depth micrometer results are shown as both the average of all 50 readings and the average of the 5 maximums. It was observed that the characteristics produced by the tools challenged some of the measurement tools and made their results less consistent.
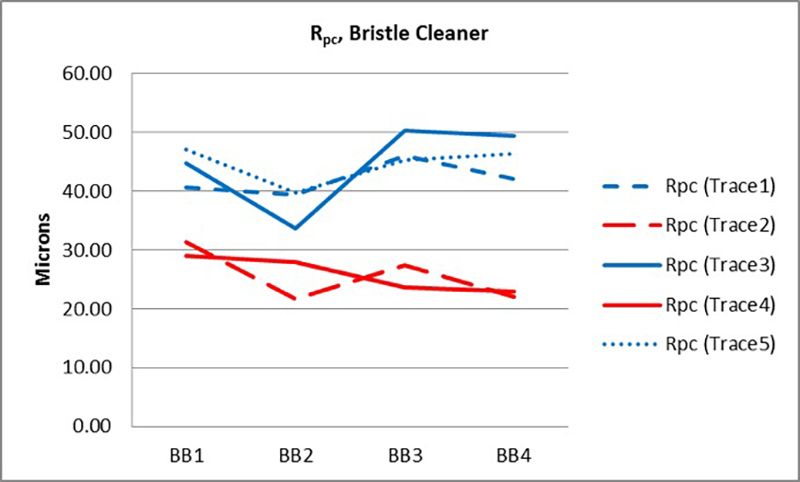
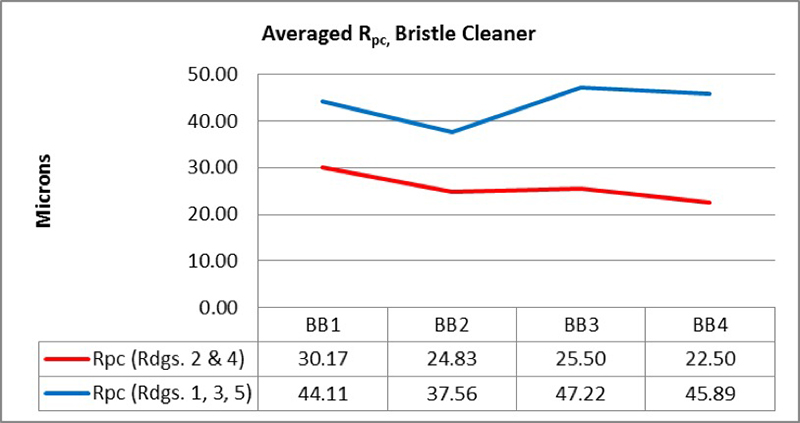
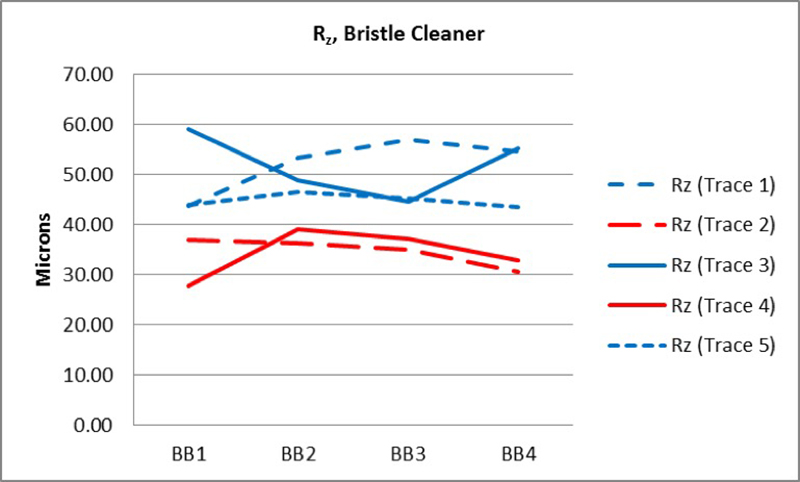
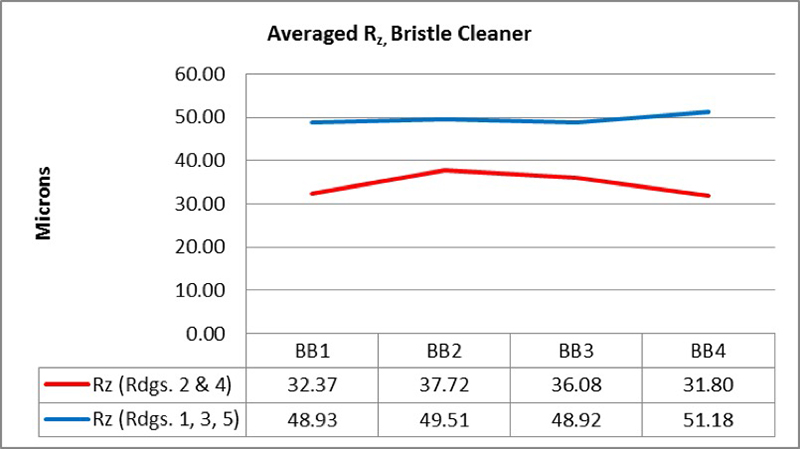
The charts below illustrate this. Individual traces are shown in Charts 2 and 4. For the bristle cleaner panels readings 2 and 4 were consistently lower for all parameters than readings 1, 3, and 5. Readings 2 and 4 were taken in the direction of the bias (shown in red), while readings 1, 3, and 5 were taken across the bias (shown in blue). Charts 3 and 5 display results of all traces taken with the bias averaged together and all traces taken across the bias averaged together.
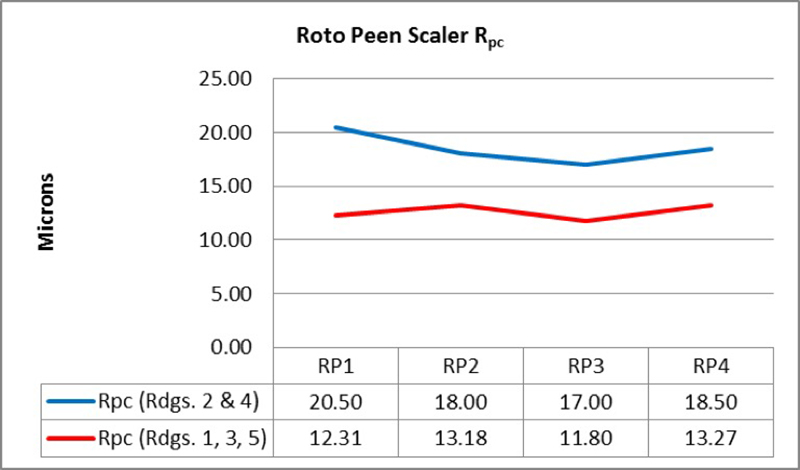
For the roto peen scaler panels, individual traces are shown in Chart 6 and 8. Readings 2 and 4 were consistently higher for all parameters than readings 1, 3, and 5. Readings 2 and 4 were taken across the direction of the bias (shown in blue), while readings 1, 3, and 5 were taken with the bias (shown in red). Charts 7 and 9 display results of all traces taken with the bias averaged together and all traces taken across the bias averaged together.


When peak densities of the three panel types were compared, the air needle scaler panel showed significantly lower measurements than the others, as seen in Chart 10.
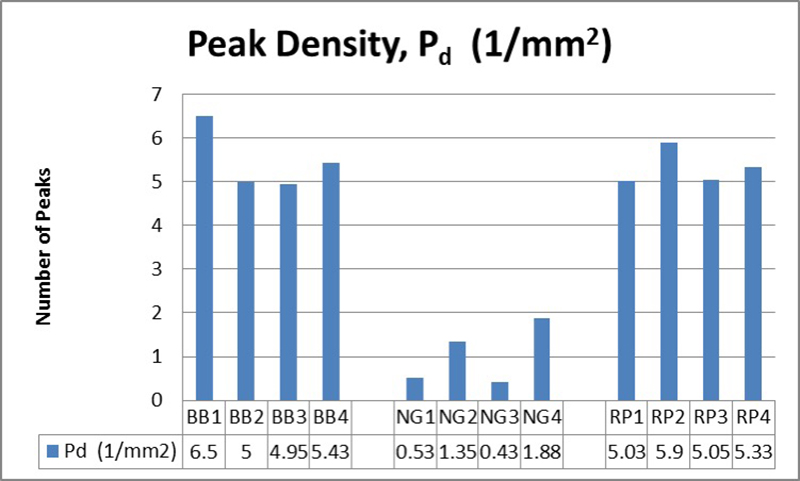
Because of the lower densities, it was hypothesized that the depth micrometer readings could be detrimentally affected due to reduced probability of the instrument being placed in the lowest valleys.
When comparing measurement methods, initial observations showed that amongst the power tool surfaces and measurement methods, Replica Tape was the least affected by influences such as bias or peak count.
After testing was complete, analysis of the data showed that results acquired with the portable stylus roughness instrument seemed to be significantly impacted by the directional bias of the panels. This was most notably present in the panels treated with the bristle cleaner, and to a lesser extent with the panels treated by the roto peen scaler.
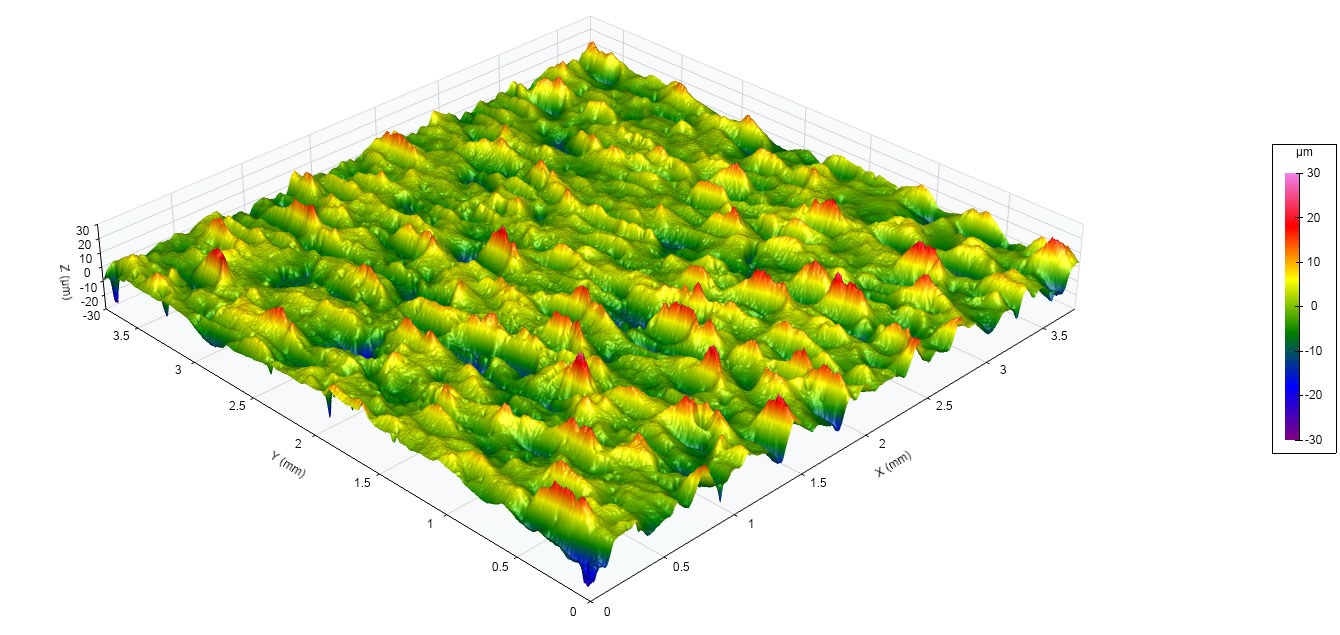
The first 3D image below of a bristle cleaner prepared surface (Figure 6) shows striations from the left to the right, corresponding to the direction the bristle cleaner was applied to the panel, essentially making valleys and/or peaks that align in that general direction. The second 3D image of a roto peen scaler surface (Figure 7) shows similar characteristics.

In order to confirm the effect this had on results acquired by the stylus roughness instrument, additional testing was performed on the bristle cleaner prepared panels with specific attention paid to the directional bias.
This additional testing was performed by taking four measurements with the bias and four measurements across the bias created by the bristle cleaner. Two values, Rpc and Rz, were then compared between the horizontal and vertical testing. The results are presented below on Charts 11 & 12:
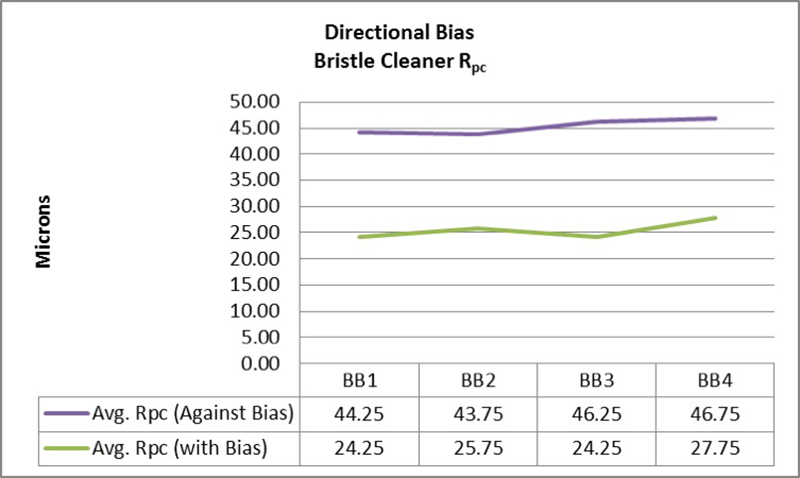
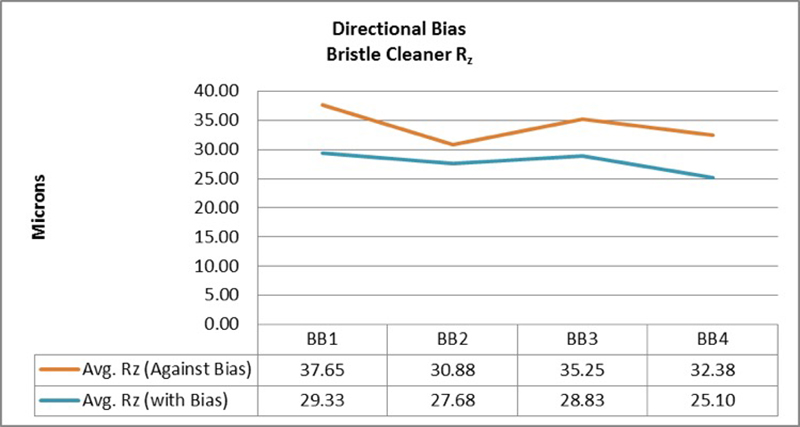
Measurements taken with the bias and across the bias yielded distinctly different results. Measurements taken by this method could lead to improper characterization of the surface if directional bias is not taken into account, or not known. This could lead to incorrect or insufficient application of a coating. Measurements taken by replica tape or depth micrometer instruments were not affected by directional bias.
The manufacturer’s user manuals were consulted for the bristle cleaner and the roto-peen scaler to determine if methods were discussed to address directional bias. No specific instructions were found discussing directional bias or the development of surface striations in either manual. The manual for the roto-peen scaler states, in regard to surface treatment, “To insure uniform peening coverage, use a circular or oscillating motion over the entire area.”
However, there are not any instructions or suggestions for use that address or prevent directional bias from occurring.
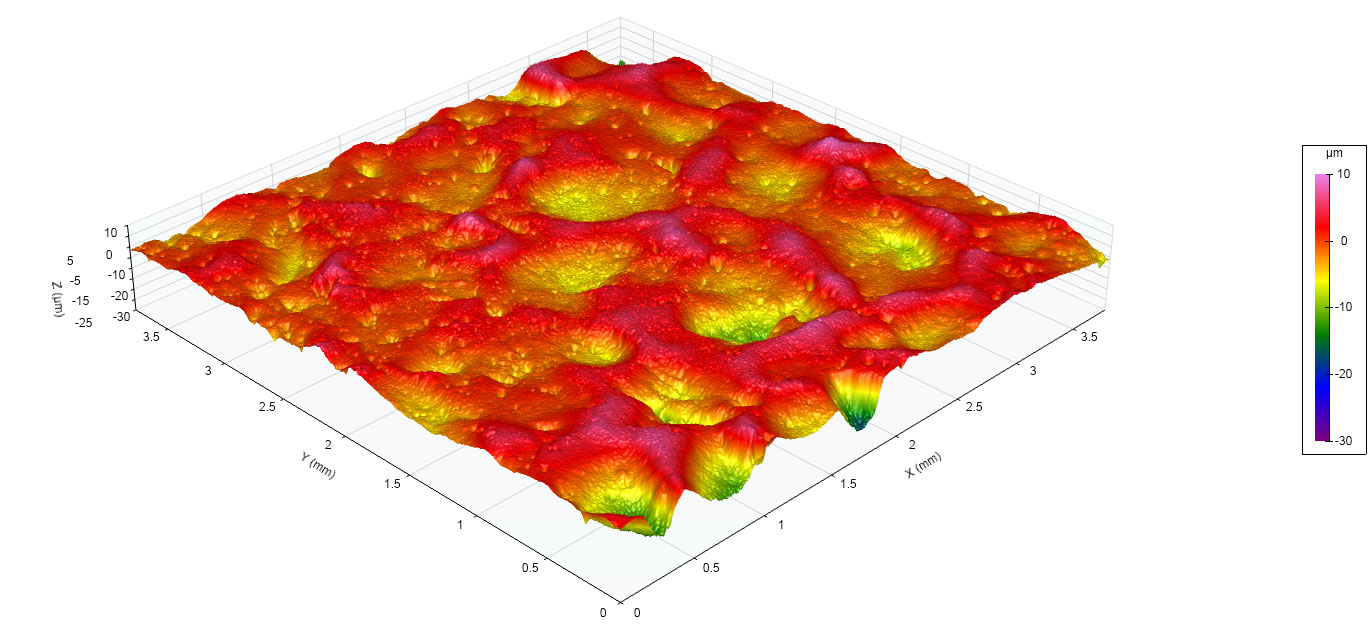
Measurement results showed that the panels produced by the air needle scaler showed low peak density when compared to the other power tool-produced panels. Lower peak densities make it more challenging for the depth micrometer to find true peak to valley height. This is due to a lower statistical probability that the point of the micrometer will land directly into the lowest point of the profile. Unless the instrument finds the lowest depression of the profile, results will be erroneously low. A 3D rendering of an air needle scaler prepared surface is shown below in Figure 8. It can clearly be seen that the surface contains few distinct peaks and/or valleys and appears mostly rounded and flat.
After low peak densities were observed using digital imaging of replica tape, it was determined that increasing the number of measurements taken with the depth micrometer produced more accurate peak to valley measurements. To test this hypothesis, the number of readings taken in each spot was doubled to 20, for a total of 100 readings per panel. By doubling the number of measurements the result is more representative of those found with a stylus roughness instrument and replica tape, as shown on Chart 13.

For three of the four panels that were examined, doubling the number of depth micrometer measurements per spot resulted in values more closely correlated with the stylus roughness instrument and replica tape. Although not investigated here, further increasing the number of readings per spot may result in readings that are more consistent with other methods.
It is hypothesized that the stylus roughness instrument will be similarly affected by lower peak density. The stylus roughness instrument measures over a larger area than the depth micrometer, however, and this larger measurement area may be sufficient to capture the highest peak and lowest valley. Regardless, the probability of finding the true maximum peak to valley profile height on air needle scaler prepared surfaces is reduced, simply due to the lower number of distinct peaks and valleys.
Measurements derived from replica tape were not affected by directional bias or peak density unlike measurements taken by other measurement methods. This method provided consistent results on all three power-tool cleaned surfaces.
With panels affected by directional bias, the measurement area of the replica tape captures patterns in both directions of the bias. Since HL is measured as the maximum peak-to-valley height across the entire area, the bias has no effect. Because of this, results from replica tape measurements were more representative of the surface and did not require modification to the measurement method to produce meaningful results.
Similarly, replica tape measurements were not negatively affected by peak density. Since the replica tape measurement area is larger than the horizontal distance between peaks and valleys, the reduced density was not a factor. Again, because of the large measurement area of replica tape, readings were more representative than with the micrometer or stylus roughness instrument.
Method C, replica tape and spring micrometers, measured the surfaces produced by all three tools most accurately, primarily because the surface area sampled is larger than that of the other methods. The increased measurement area of replica tape accounted for the characteristics of power tool-created surfaces that negatively affected the other measurement methods.
Surfaces created by power tools exhibit characteristics that must be taken into consideration when selecting a surface profile measurement method. Tools that leave directional striations (bias) on the surface can result in inaccurate measurements of surface profile parameters when portable stylus roughness instruments are used. Tools that result in surface profiles with low peak densities are not anticipated in the Standards (ASTM D4417) and as a result, lower peak-to-valley measurements are reported when using a depth micrometer in accordance with that test method. Failure to account for these characteristics can result in inaccurate results.
Although there are limitations when using portable stylus roughness instruments and depth micrometers on power tool prepared surfaces, there are modifications that can be made to the measurement methods that allow these instruments to measure these surfaces effectively. Method D stylus roughness instruments were not suitable for measuring surface profile on these surfaces unless care was taken to only measure across the bias. Readings from Method B depth micrometers suggested that results would improve by increasing the number of readings to account for the low peak density.
Additionally, results from the Method B depth micrometers clearly showed that using the average of the maximums for the five locations produced results that correlated more closely to results from the other measurement methods when compared to using the average of the 50 individual readings. This supports other studies that have been done with the same findings, notably “Surface Profile – A Comparison of Measurement Methods” by D. Beamish9, where this method was first proposed.
Chart 14 shows results across all measurement methods after adjustments had been made to account for errors caused by directional bias and low peak density. Directional bias has been accounted for on the bristle cleaner and roto peen scaler prepared panels by removing the trace measurements taken in the direction of the bias. This resulted in a result that was an average of 13.2% closer to the replica tape results for the bristle blasted panels, and an average of 8.9% closer to the replica tape readings for the roto peen treated panels.
Low peak density on the air needle scaler panels has been accounted for by plotting the results with both 10 and 20 readings per spot, and reporting the average of the maximums for the five locations. By doing so, the readings taken by the depth micrometer showed a 15.9% closer correlation to the portable stylus roughness instrument readings, and a 14.2% closer correlation to the replica tape readings.
The replica tape results, however, are displayed as measured, with no modification for surface effects. It is clear that the tape’s unmodified results are in line with other measurement methods.
These results strongly suggest that replica tape presents a simpler and more effective solution for measuring across surfaces created by multiple power tools. The tape requires no special consideration for bias or peak density. Unlike other measurement methods that require power tool-created profile effects to be taken into account, replica tape results can be used as measured.
Within the painting and coating industry, there has been significant research into evaluating blast-cleaned profiles on steel substrates.
ISO 8503-5—Preparation of steel substrates before application of paints and related products – Surface roughness characteristics of blast-cleaned steel substrates – Part 5: Replica tape method for the determination of the surface profile3
ISO 8503-5 describes the preparation of steel substrates before application of paints and related products and the surface roughness characteristics of blast-cleaned steel substrates:
1 Scope
This document describes a field method for measuring the surface profile produced by any of the abrasive blast-cleaning procedures given in ISO 8504-2. The method uses replica tape and a suitable gauge for measuring, on site, the roughness of a surface before the application of paint or another protective coating.
The method is applicable within the range of profile heights cited for a given grade (or thickness) of replica tape. The commercial grades currently available permit measurement of average peak-to-valley profiles of 20 μm to 115 μm. The method is valid for surfaces that have been cleaned with abrasives.
ASTM D7127—Standard Test Method for Measurement of Surface Roughness of Abrasive Blast Cleaned Metal Surfaces Using a Portable Stylus Instrument4
ASTM D7127 describes the measurement of surface roughness of abrasive blast-cleaned metal surfaces using a portable stylus instrument:
1. Scope
1.1 This test method describes a shop or field procedure for determination of roughness characteristics of surfaces prepared for painting by abrasive blasting. The procedure uses a portable skidded or non-skidded stylus profile tracing instrument. The measured characteristics are: Rt and Rpc. Additional measures of profile height (Rmax and/or Rz) may also be obtained as agreed upon by purchaser and seller.
NACE SP0287—Field Measurement of Surface Profile of Abrasive Blast-Cleaned Steel Surfaces Using a Replica Tape5
NACE SP0287 describes and characterizes one procedure for measuring the surface profile of abrasive blast cleaned steel. The measurement technique uses a tape that replicates the surface profile. Other common methods of measuring surface profile are not discussed:
1.1 This standard describes a procedure for on-site measurement of the surface profile of abrasive blast-cleaned steel surfaces that have a surface profile, as defined in Section 2, between 38 and 114 μm (1.5 and 4.5 mils)
ASTM D4417—Standard Test Methods for Field Measurement of Surface Profile Blast Cleaned Steel
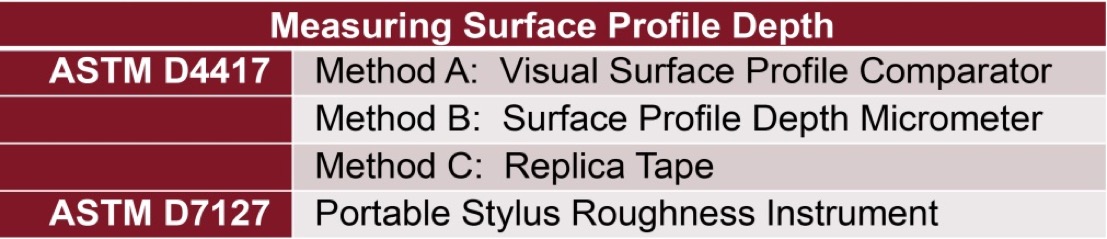
ASTM D4417 describes three methods for evaluating the surface profile of blasted steel surfaces in Table 1 below:
1. Scope
1.1 These test methods cover the description of techniques for measuring the profile of abrasive blast cleaned surfaces in the laboratory, field, or in the fabricating shop.
SSPC PA 17—Determining Profile Compliance6
SSPC PA 17 provides additional guidance for determining conformance with surface profile requirements. Whereas ASTM standards describe how to take measurements, SSPC PA 17 focuses on where to take these measurements and how often.
Largely absent from these industry standards are procedures and descriptions for the evaluation of power tool cleaned surfaces. As the use of power tools becomes more prevalent, it is increasingly important to determine the best and most accurate way to evaluate these surfaces.
Within these standards, there is only one mention of how to evaluate power tool prepared surfaces. ASTM D4417-14 paragraph 1.2 states, “Method B may also be appropriate to the measurement of profile produced by using power tools.”
Lacking standards and/or guidance, there is little information as to whether ASTM D4417 Method B is the best method for all power tool surfaces or if there may be other, more dynamic solutions for measuring surfaces. Power tool prepared surfaces exhibit characteristics that are not present in blast-cleaned surfaces, namely directional bias and peak density variations between tools. The impact of these characteristics on specific measurement methods is not well known.
1 ASTM D4417 “Standard Test Methods for Field Measurement of Surface Profile of Blast Cleaned Steel” (ASTM International, 100 Barr Harbor Drive, West Conshohocken, PA 19428)
2 D. Beamish, “Replica Tape – Unlocking Hidden Information”, Journal of Protective Coatings and Linings, February 2015, pp. 1 – 6
3 ISO 8503-5 “Preparation of steel substrates before application of paints and related products — Surface roughness characteristics of blast-cleaned steel substrates — Part 5: Replica tape method for the determination of the surface profile” (International Organization for Standardization (ISO), 1 rue de Varembé, Case postale 56, CH-1211, Geneva 20, Switzerland)
4 ASTM D7127 “Standard Test Method for Measurement of Surface Roughness of Abrasive Blast Cleaned Metal Surfaces Using a Portable Stylus Instrument1 (ASTM International, 100 Barr Harbor Drive, West Conshohocken, PA 19428)
5 NACE Standard SP0287, “Field Measurement of Surface Profile of Abrasive Blast-Cleaned Steel Surfaces Using a Replica Tape”. (Houston, TX: NACE, 2016)
6 SSPC-PA-17 “Procedure for Determining Conformance to Steel Profile/Surface Roughness/Peak Count Requirements” (SSPC: the Society for Protective Coatings,800 Trumbull Drive, Pittsburgh, PA 15205, USA)
7 ASME Y14.36M 1996 “Surface Texture Symbols” (The American Society of Mechanical Engineers, Three Park Avenue, New York, NY 10016-5990 USA)
8 ASME B46.1-2009 “Surface Texture (Surface Roughness, Waviness, and Lay)” (The American Society of Mechanical Engineers, Three Park Avenue, New York, NY 10016-5990 USA)
9 D. Beamish, “Surface Profile – A Comparison of Measurement Methods”, DeFelsko Corporation, January 2013

.jpg)