Steel surfaces are frequently cleaned by abrasive impact or by power tools prior to the application of protective coatings. The resultant surface profile must be accurately assessed to ensure compliance with job or contract specifications.
But is profile height alone (the most commonly measured parameter) a good indicator of long term coating performance?
This paper reports on recent testing that compared numerous profiles with pull-off adhesion. A simple, low-cost field device was used to obtain 3 profile parameters from 1 replica tape measurement: profile height, peak density, and developed surface area. Test surfaces were re-measured with complex, expensive 3D microscopes and results were compared to replica tape results.
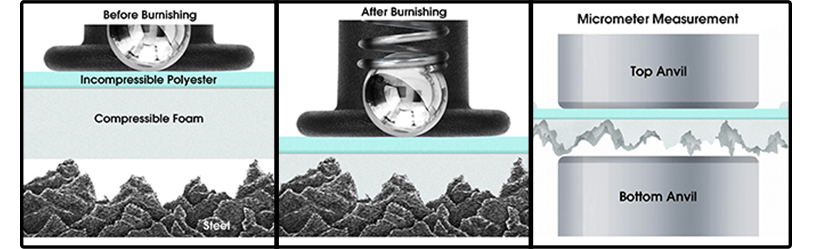
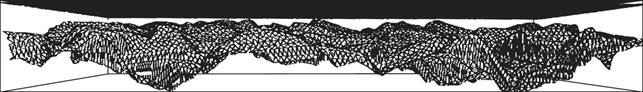
Abrasive blast and power tool cleaning of steel surfaces removes previous coatings, mill scale, rust and contaminants. It also roughens the surface to improve coating adhesion. The resultant surface profile, or anchor pattern, is comprised of a complex pattern of peaks and valleys which must be accurately assessed to ensure compliance with job or contract specifications and ensure a successful coatings project (Fig.1).
It is generally accepted that the nature of these surfaces is predictive of long term coating performance. Characteristics of a blasted surface include peak height, peak density, developed surface area, angularity, sharpness, and shape. Only peak height (H) is commonly measured today. If this height is insufficient, paint will not adhere. If too great, more paint is required to fill the “valleys” and the high peaks may protrude through the paint to become foci for corrosion.
Early characterization methods consisted of visual standards which were placed onto the blasted surface for comparison. While still used today, this qualitative solution has been largely supplanted by quantitative measurement devices that range in price and complexity depending upon whether they are intended for field or lab use. The current, most popular field methods involve measuring the profile’s average peak-to-valley height using depth micrometers and/or replica tape.
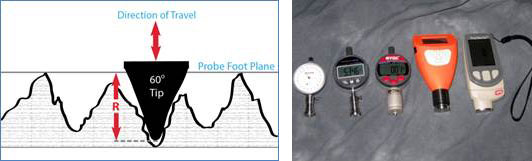
A depth micrometer surface profile instrument has a flat base which rests on the surface and a spring-loaded probe which drops into the valleys of the surface profile. The flat base rests on the highest peaks and each measurement is therefore the distance between the highest local peaks and the particular valley into which the tip has projected. Generally intended for flat surfaces, these devices have the benefit of measuring large profile heights that exceed the range of most other instruments (Fig.2).
Replica tape, the focus of this paper, has long been known for characterizing surfaces. It is simple, relatively inexpensive and is particularly useful on curved surfaces. Its operation is described in a number of international standards including ASTM1 D44172, ISO 8503-53, NACE RP02874, and AS 3894.55.
Replica tape consists of a layer of compressible foam affixed to an incompressible polyester substrate of a highly uniform thickness of 2 mils +0.2 mils6 (50.8 microns + 5 microns). When pressed against a roughened steel surface the foam collapses and forms an impression of the surface. Placing the compressed tape between the anvils of a micrometer thickness gage and subtracting the contribution of the incompressible substrate, 2 mils or 50.8 microns, gives a measure of the surface profile height(Fig.3).

In 1974 Keane et al.7 wrote that a surface prepared for painting via blast cleaning could not be completely described by measuring peak-to-valley distance (H) alone. Their paper supported field experience which suggested that there was another important parameter besides H, namely, the number of peaks per unit length (Peak Count - Pc) or peaks per unit area (Peak Density - Pd). Besides increasing bonding surface area, the paper explained that increasing the number of peaks in a defined area increased the angularity of that area. That put more shear adhesion stress on the coating rather than tension (pull-off) stress. This increased coating bond strength for the applied coating as shear values are always higher than tensile values. The applied coating, of course, must wet out 100% of the surface.
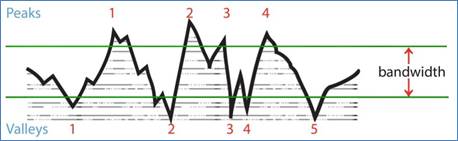
Figure 4 is a simplified example of why BOTH peak height AND peak density are important to the understanding of coating performance. The two surfaces have different geometries yet their height measurements are the same. To get a clearer picture of the surface available for bonding, peak count measurements must also be obtained. Furthermore, both measured values make it possible to investigate the increase in surface area resulting from the abrasive blasting process.

There is little doubt that peak density measurements are important to the corrosion industry, but the problem until now is that peak counts have not been easy to determine.
In June of 2005 a significant paper by Roper et.al.8 reported peak counts could be controlled and, like peak height, affect coating performance. Their work resulted in the creation of ASTM D71279 which was also published that year.
In a follow-up article the following year they concluded “the optimum steel profiles for a wide range of standard industrial coatings that will completely wet the surfaces are a 2 to 3 mil (50 to 75 micron) profile height and a peak count between 110 and 150 peaks/inch (40 and 60 peaks/cm). "Optimum peak count for a particular coating depends on its rheological properties”. They explained that, “a general rule for adjusting peak count to optimize coating performance is to use the smallest, hardest abrasive that will do the job. To obtain a uniform surface, control the blast technique and the particle size of the abrasive. The coating must be able to wet the surface completely.”10
The authors recommended that stylus roughness instruments, the best field instrument available at the time, be used in the corrosion industry to provide both critical pieces of profile information -- peak height AND peak density.
Stylus roughness instruments record the up and down movements of an external stylus traversing across a surface (Fig.5). They measure a height parameter called Rt in compliance with ISO11 428712, which yields the vertical distance between the highest peak and lowest valley within any given evaluation length of 0.5 inches (12.5 mm). Five traces are made and Rt values averaged to obtain the average of the maximum peak-to-valley distances.
A 2011 ASTM round robin study13 determined peak-to-valley height Rt as measured by stylus roughness instruments related closely to H as measured by depth micrometers and replica tape.

But if stylus roughness instruments could generate measurements of both peak height and the number of peaks encountered along a sampling length, why has the corrosion industry been slow to adopt them?
Likely this reluctance is based on economic and practical reasons. Stylus roughness instruments are fragile in nature since they depend on a precisely calibrated stylus that often extends a distance from the body of the device itself. They can be complex to set up and to operate, and they report a number of roughness parameters that are of limited interest to the coatings industry. All these factors likely dissuade potential users.
What other measuring solutions are available? It is anecdotally believed within the corrosion industry that definitive measurement devices must use laboratory methods such as white light interferometry, focus variation microscopy, confocal laser microscopy and atomic force microscopy. But these powerful devices are challenged when measuring complex blasted surfaces. They are costly to purchase, do not operate in the field, and require extensive training to set-up myriad test parameters for topographic analysis including such things as dead band regions, area-scale plots, complexity-scale analysis, filters, stitching, and spatial area patch sizes.
Corrosion professionals simply want to know if they have a good surface upon which to apply a coating. Has the surface been prepared suitably? Is it acceptable to the customer? They want measurable objectives and adjustable blast parameters with which to meet those objectives.
It is therefore desirable to have one affordable, robust field instrument designed specifically for the corrosion industry that provides both peak height (H) and peak density (Pd) measurements to give inspectors a more meaningful and functionally correlative prediction of coating performance during surface preparation.
The solution lies with replica tape. It is not widely known that surface replicas obtained using Testex Tape contain far more information than just peak height as measured by a micrometer. Significant data is available through digital imaging.
Replica tape has been used to measure the profile of abrasive blasted steel since the late 1960's. Its operation is described in a number of international standards including ASTM D4417, ISO 8503-5 and NACE RP0287. Compared to other methods, it has the advantages of ruggedness, relatively low start-up cost, good repeatability and the option of retaining a physical replica of the surface being evaluated. The method is widely used and widely understood. (Fig.7)
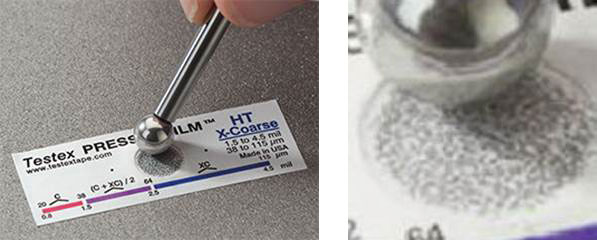
An additional advantage, sometimes underappreciated, is that, unlike stylus techniques, the replica method samples a contiguous 2-dimensional (2D) area that is sufficiently large to yield robust statistics. A single electronic surface roughness tester scan, for instance, samples a line along an abrasive-blasted surface that is 12.5 mm (0.5”) long and 10 μm wide for a total area of 0.12 mm2. A single plastic foam replica samples approximately 31 mm2, an area 250 times greater.A new approach is to use a property of the tape that is related to, but different from, its capacity to replicate surfaces, that is, the tape’s increase in optical transmission where it is compressed. Transmission is proportional to degree of compression. Many of the tests performed for this paper used existing Coarse and X-Coarse grades of replica tape. For improved optical resolution and to reduce optical artifacts, the Testex Company14 also supplied an optical-grade version of their X-Coarse grade tape that was recently made commercially available.
A photograph of a back-lit piece of tape (Fig.9) reveals light areas of higher compression (peaks) and dark areas of lower compression (valleys).

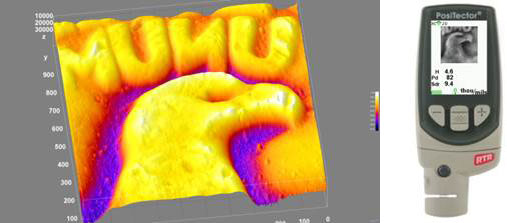
Using the transparency principle, peak counts can be determined by simply counting bright spots on the impression as taken by a digital image sensor. These brightness measurements correspond to thickness measurements, which, in turn, mirror the profile of the original surface. A portable instrument (Fig. 11) can identify peaks and determine areal peak density, that is, how many peaks are present per square millimeter, or Pd, as defined by ASME B46.115.
Although popular in metal machining industries, stylus-based roughness testers are challenged by the complex patterns generated by surface cleaning operations. They measure only a single line on a roughened surface and most of the features it records as “peaks” are actually “peak shoulders” where the stylus traced over the side of the peak rather than over the top of the peak (Fig.16). In contrast, replica tape peak counters, like delicate and expensive laboratory-grade interferometric optical profilers, calculate true two dimensional peak densities.
Another advantage of these images is that more data is used to derive each measurement (1,000,000 points for a single replica tape measurement vs. 5,000 points for a single 1” stylus scan). In addition, this is all done with a rugged field instrument that uses inexpensive hardware to obtain surface characterization data similar to that obtained from laboratory instruments.
Additional surface characterization parameters can be extracted once the thickness/transparency relation has been applied to interpretation of the intensity image using three dimensional (3D) rendering software. The result is 3D maps of the blasted steel surface at a cost far less than interferometric or confocal profiling devices. An example of how the process works is shown in Figures 10 thru 12.


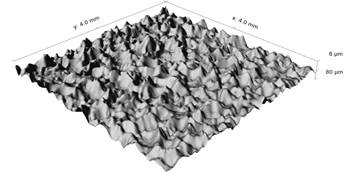
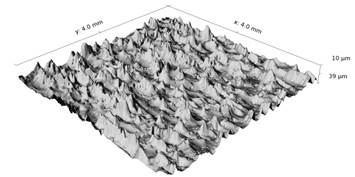
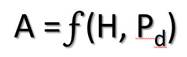
From 3D images it is possible to measure a final, related parameter believed to help promote both chemical and mechanical bonding, that is, the increase in surface area resulting from a blasting operation. Sdr is the Developed Interfacial Area Ratio16 expressed as the percentage of additional surface area contributed by the texture as compared to an ideal plane the size of the measurement region. Coating professionals believe this profile parameter gives functional correlation to application technique by providing them with a rugosity value – the additional surface area created by blasting as a percentage increase (real area / x-y area).17 Later discussions in this paper, however, will suggest there is little practical merit in reporting developed surface area in the blast cleaning industry.
To substantiate 3D replica tape measurements, the two new parameter measurements obtained from the tape, peak density Pd and developed surface area Sdr, were compared to two established surface roughness measurement methods: confocal microscopy and stylus profilometry.
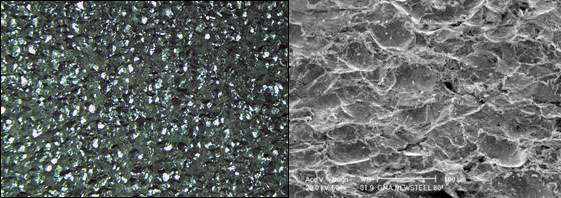
The first step taken was to confirm that light intensity imaging of replica tape yielded Pd and Sdr values comparable to those obtained using known laboratory methods. A study was carried out using three steel panels prepared by KTA Labs18. Amasteel G-50, GMA Garnet Coarse, and Amasteel S-230/G40 blasting media were used. The three panels were sent to WPI19 along with 3 sets of burnished optical-grade replica tape for measurement with a LEXT Confocal Microscope (Fig.13).

The images were thresholded at the mean value plus 10% of Sz20. All islands greater than 1,000 µm2 were counted as a peak for comparative purposes. Results were comparable (Fig. 14).

To compare measurements from 3D replica tape images with stylus roughness instruments, measurements of peak density were taken on the five panels used in the 2011 ASTM round robin study. This provided stylus test results from eleven independent operators who measured linear peak counts, Pc or Rpc, five times on each of the five panels using three commercially available stylus roughness instruments: the Mitutoyo SJ-201, the Taylor Hobson Surtronic 25, and the MahrSurf PS1.
To obtain 3D replica tape imaging data, three burnishings were made on each panel using optical-grade replica tape and measured with the PosiTector 6000 RTR-P replica tape imager (Fig.11).
Because stylus roughness instruments yield a 2D measurement in peaks/mm and the 3D replica tape method yields measurements in peaks/mm2, the two sets of data are not directly comparable. For the purposes of this analysis, the stylus roughness measurements were squared, so that both measurement techniques would yield dimensionally comparable measurements. A comparison of the measurement methods is summarized in figure 15.

As can be seen from this chart, there is a strong linear relationship between the two measurement methods. The measurements on four of the five tested panels fall within one standard deviation of a trend line through the origin. However, two observations can be drawn from figure 15. First, there is not a 1:1 relationship between the two measurement methods. Second, the data is not a perfect fit to the trend line, resulting in an R2 value of 0.91.
The lack of a 1:1 relationship between the squared measurements of the stylus instrument and the 3D imaging methods is not surprising. Although squaring the stylus instrument’s measurements results in measurements with the same dimensions, it cannot account for the stylus instrument’s two dimensional nature. For example, when tracing a straight line it is possible to cross one ridge multiple times, resulting in multiple ‘peaks’ where in reality there is a single peak adjacent to the path of the stylus. Additionally, the classification of what constitutes a ‘peak’ in three dimensions is not trivial, and the 3D imaging analysis likely ignores features that would register as a peak on the stylus roughness instrument.

Stylus roughness instruments may register 0, 1 or 2 peaks depending upon the trace path. It is unclear why the data does not perfectly fit the trend line. Since each of the five test panels was intended to reflect a wide range of different preparation methods, it is likely the discrepancy is at least in part due to the shortcomings of the stylus instrument. On profiles with sharp, narrow peaks, the stylus can sometimes go around of the peak, instead of traveling over it. This can result in the stylus instrument under-reading on some profiles.
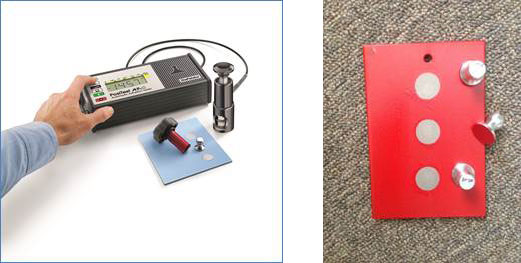
Given the previous research by Roper et. al. on the correlation between adhesion and both profile height (H) and peak density (Pd), a study was carried out to determine if 3D replica tape imaging methods gave similar results. Twenty five steel samples were prepared by Sponge-Jet21 using a variety of blast media. After blasting, measurements were performed with the 3D replica tape imager. The samples were then sprayed with an epoxy, a 2-component acrylic, and a polymer composite coating and allowed to cure. Three pull-off adhesion tests were then performed on each sample following the test method described in ASTM D454122 using a Type V hydraulic pull-off adhesion tester described in Annex A4 (Test Method E) of that standard (Fig. 17).
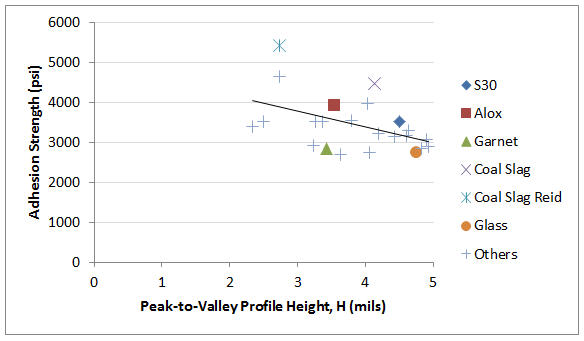
In the 2006 Roper et.al paper, it was theorized that “From the authors’ experience, the optimum steel profiles for a wide range of standard industrial coatings that will completely wet the surfaces are a 2- to 3-mil (50- to 75-micron) profile height”. The observations in this study appear to affirm this hypothesis. The highest adhesion strengths were observed in the 2 – 3 mil range, with adhesion values decreasing as profile heights increased above 3 mils (Fig.18). Although no samples were taken with profile heights below 2 mils, it is theorized that adhesion levels would begin to decrease with decreasing profile height. As stated previously in this paper, it is theorized that adhesion begins to decrease at profiles above 3 mils because of the coating fails to fully wet the substrate. It is theorized that adhesion begins to decrease at profiles below 2 mils because there is insufficient profile to anchor the coating. A hypothetical trend line with Pd and Sdr held constant is overlaid on this study’s data in figure 19.
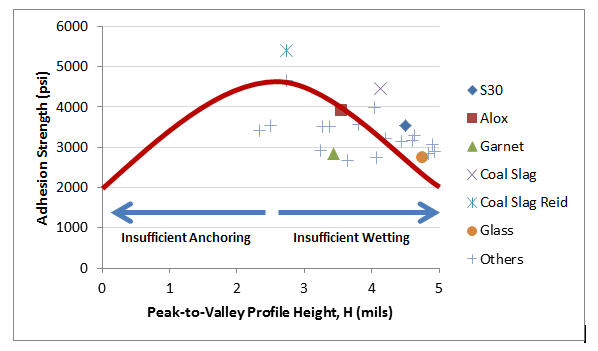
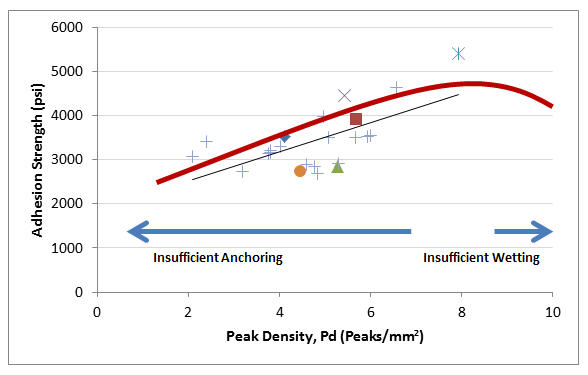
There appears be a strong positive correlation between peak density and adhesion (Fig.20), reinforcing Roper et.al’s hypothesis that peak count is relevant to coating performance. Their paper asserted “the optimum steel profiles for a wide range of standard industrial coatings that will completely wet the surfaces are … a peak count between 110 and 150 peaks/in (40 and 60 peaks/cm)”.

Since the authors used a stylus profilometer in their research, their numbers are not directly comparable to the data in this study. However, using the apparent relationship between stylus profilometer measurements and 3D replica tape optical measurements reported earlier in this paper, an equivalent 3D peak density of between 4 and 8 peaks/mm2 can be derived. It is therefore hypothesized that the observed positive relationship between adhesion strength and peak density would not persist at peak densities greater than those observed in this study. This theorized relationship between adhesion and Pd with H and Sdr held constant is shown in Figure 21.
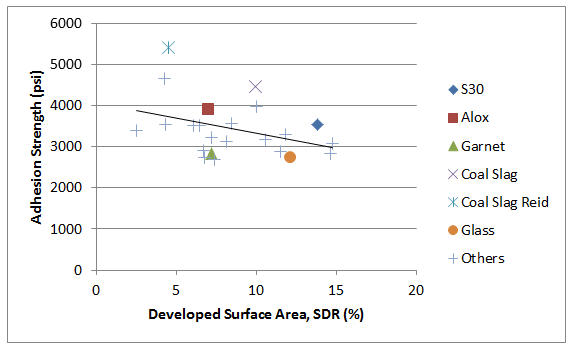
A plot of observed developed surface area versus adhesion is summarized in figure 22. The data at first appears to contradict Roper et. al’s assertion that “the greater the surface area for coating, the better”. However, the authors go on to assert that the two primary ways to increase surface area, increasing peak height and increasing peak density, can inhibit wetting and be detrimental to coating performance beyond an optimum point. It is believed the data in this study reflects their assertion. The high developed surface area measurements in several of the samples (glass beads for example) seem to have been a reflection of the high peak-to-valley distances in those samples. It is therefore no surprise that the samples with high developed surface areas due to excessively high peak-to-valley heights exhibited poor coating performance.
It is believed that the amount of increased surface area resulting from abrasive blasting is directly related to peak height and peak density thus negating the need to measure and report it. A further discussion is presented in the Appendix.
It is generally accepted that the nature of abrasive blast cleaned steel surfaces is predictive of long term coating performance. The corrosion industry does not fully understand the dynamics of this complex problem, but it has several measurable parameters available to it including peak height, peak density, surface area, angularity, sharpness, and shape. Commonly held industry beliefs would suggest increasing several of these parameters will improve long term coating performance. Empirical data suggests it is not that simple.
The most important of these parameters, peak height (H), is commonly measured today and is usually the only parameter reported. While its importance is undeniable, one parameter alone does not fully describe the dynamics of a coating/substrate relationship.
Peak density (Pd) is also an important indicator of performance. While it also cannot be a sole measure like H has been for several decades, together with H it provides a better prediction of long term coating performance as measured by pull-off adhesion testing.
This relationship helps explain why H measurements alone have not always been a reliable method for predicting performance for all coating types. A coating may bond to a surface with low H and high Pd just as well as to one with high H and low Pd. For this reason the corrosion industry should report both values so that customers can determine the best ratio for their particular coating application. Both parameters are controlled with the proper selection of abrasive material type and size. Perhaps a hybrid parameter will be specified in the future.
Surface replicas obtained using replica tape contain far more information than just H as measured by a micrometer. Significant data is available through digital imaging. A simple and low cost portable apparatus using thickness and imaging sensors can characterize replica tape and generate images and statistics of the original surface, most importantly, Pd.
Results from this study confirm a close relationship between replica tape, stylus roughness and confocal microscopy measurements of the 2 most important parameters:
H – The average of the maximum peak-to-valley distances obtained by measuring the thickness of burnished replica tape with a micrometer or a thickness sensor that adjusts for tape non-linearity. Best pull-off adhesion values result from uniform profile heights in the range of 2.5 mils (65 µm) with a high peak count surface where the applied coatings wet out one hundred percent of the surface.
Pd – Areal peak density in accordance with ASME B46.1. Increasing this value increases angularity to develop more strength in shear adhesion rather than tensile. For best coating adhesion (corrosion protection) peak count should be as high as possible while ensuring complete wetting of the prepared surface.
The author would like to acknowledge the assistance of Leon Vandervalk of DeFelsko Corporation.
Limitations of Sdr
According to ASME B46.1, the developed interfacial area ratio Sdr is the percentage of additional surface area contributed by the texture as compared to an ideal plane the size of the measurement region as calculated in figure 23. It is calculated as a function of scale by summing the areas of a series of virtual tiles covering the measured surface in a patchwork fashion.
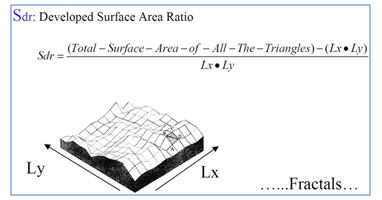
The difficulty in using this method to characterize an abrasive blasted steel surface is that the calculations are subject to the interpretation of the definition. If a laboratory selects a very small triangle size with a high resolution scanning device they will inevitably state a higher increase in surface area than another lab using different equipment with lower threshold settings (Fig.24). The total area measured by the triangle tiles increases as the scale of observation (tile area) decreases.
It is believed that the amount of increased surface area resulting from abrasive blasting is directly related to peak height and peak density thus negating the need to measure and report it. H and Pd are sufficient. An alternative is to calculate it in a similar manner to the following Pythagorean formula:

It is hypothesized that if peak height and peak density were held constant, there would be a positive correlation between developed surface area and adhesion strength. However, this positive correlation appears slight, and as this study shows, is not significant compared to the effects of peak height and peak density. Furthermore, the author of this paper is unaware of any practical means of modifying developed surface area with abrasive media while maintaining peak height and peak density values constant. Therefore there seems little practical merit in reporting developed surface area in the blast cleaning industry.
-------------------------------------------------------------------------------------------------------------------
1 ASTM International, 100 Barr Harbor Drive, West Conshohocken, PA 19428.
2 ASTM D4417 “Standard Test Methods for Field Measurement of Surface Profile of Blast Cleaned Steel” (ASTM International, West Conshohocken, PA)
3 ISO 8503-5 “Preparation of steel substrates before application of paints and related products — Surface roughnesscharacteristics of blast-cleaned steel substrates — Part 5: Replica tape method for the determination of the surface profile” (Geneva, Switzerland: ISO)
4 NACE Standard RP0287-2002, “Field Measurement of Surface Profile of Abrasive Blast-Cleaned Steel Surfaces Using a Replica Tape”. (National Association of Corrosion Engineers (NACE), 1440 South Creek Dr., Houston, TX USA 77084-4906)
5 Australian Standard AS 3894.5-2002, “Site testing of protective coatings, Method 5: Determination of surface profile”. (Standards Australia, GPO Box 476, Sydney NSW 2001 Australia)
6 To convert from imperial to metric units, use 1 mil = 25.4 microns (μm).
7 J.D. Keane, J.A. Bruno, and R.E.F. Weaver, Surface Profile for Anti-Corrosion Paints, Publication #74-01, SSPC: The Society for Protective Coatings, Pittsburgh, PA 15222, 1974
8 H.J. Roper, R.E.F. Weaver, and J.H. Brandon, The Effect of Peak Count or Surface Roughness on Coating Performance, Journal of Protective Coatings and Linings, June 2005, pp. 52 - 64
9 ASTM D7127 “Standard Test Method for Measurement of Surface Roughness of Abrasive Blast Cleaned Metal Surfaces Using an Electronic Portable Stylus Instrument” (ASTM International, West Conshohocken, PA)
10 H.J. Roper, R.E.F. Weaver, and J.H. Brandon, Peak Performance from Abrasives, Journal of Protective Coatings and Linings, June 2006, pp. 24 - 31
11 International Organization for Standardization (ISO), 1 rue de Varembé, Case postale 56, CH-1211, Geneva 20, Switzerland
12 ISO 4287: 1997 “Geometrical Product Specifications (GPS)—Surface Texture: Profile Method—Terms, Definitions, andSurface Parameters” (Geneva, Switzerland: ISO)
13 ASTM Research Report RR:D01-1169 (ASTM International, West Conshohocken, PA)
14 Testex, 8 Fox Lane, Newark, DE 19711 USA
15 ASME B46.1-2009 “Surface Texture (Surface Roughness, Waviness, and Lay)” (The American Society of Mechanical Engineers, Three Park Avenue, New York, NY 10016-5990 USA)
16 ISO 25178-2 “Geometrical product specifications (GPS) – Surface texture: Areal – Part 2: Terms, definitions and surface texture parameters” (International Organization for Standardization (ISO), 1 rue de Varembé, Case postale 56, CH-1211, Geneva 20, Switzerland)
17 C.A. Brown and S. Siegmann, "Fundamental scales of adhesion and area-scale fractal analysis," International Journal of Machine Tools and Manufacture, 41 (2001) 1927-1933
18 KTA-Tator, Inc. (KTA), 115 Technology Drive, Pittsburgh, PA 15275 USA.
19 Worcester Polytechnic Institute. (WPI), 100 Institute Rd., Worcester, MA 01609-2208 USA Matthew A. Gleason under the oversight of Professor Christopher A. Brown.
20 This is a 3D parameter expanded from the roughness (2D) parameter Rz. It is the distance between the maximum peak and the maximum valley on the surface within the measured area.
21 Sponge-Jet, Inc., 14 Patterson Lane, Newington, NH 03801 USA under the supervision of Michael Merritt
22 ASTM D4541 “Standard Test Method for Pull-Off Strength of Coatings Using Portable Adhesion Testers” (ASTM International, West Conshohocken, PA)
23 Christopher A. Brown, William A. Johnsen, Kevin M. Hult, Scale-sensitivity, Fractal Analysis and Simulations, Int. J. Mach. Tools Manufact. Vol 38, Nos 5-6, pp. 633-637, 1998)

DAVID BEAMISH (1955 – 2019), former President of DeFelsko Corporation, a New York-based manufacturer of hand-held coating test instruments sold worldwide. He had a degree in Civil Engineering and more than 25 years of experience in the design, manufacture, and marketing of these testing instruments in a variety of international industries including industrial painting, quality inspection, and manufacturing. He conducted training seminars and was an active member of various organizations including NACE, SSPC, ASTM and ISO.


.jpg)